Introduction
Ecommerce brands today manage hundreds—sometimes thousands—of SKUs across multiple platforms, yet most analytics dashboards show only aggregate store-level revenue or traffic. When a category is underperforming, standard tools tell you which category is lagging, but not which specific product variants are dragging down margin or sitting stagnant in warehouses. At scale, this blind spot is expensive: global retail loses an estimated $1.75 trillion annually to inventory distortion—overstocks tying up capital and stockouts erasing revenue opportunities.
SKU-level analytics surfaces what generic dashboards miss. Across India's Quick Commerce platforms—Blinkit, Zepto, Swiggy Instamart, JioMart—the signals that matter most are granular: which product variants drive repeat orders in a specific city, which "hero products" steadily erode margin after returns and fulfilment costs, and which SKUs go dark in certain pincodes when dark store stock runs out.
For brands scaling across multiple QC platforms and regions, that granularity is the difference between guessing where to allocate inventory and budget versus knowing.
This guide breaks down what SKU-level analytics actually means for high-frequency FMCG and Quick Commerce brands in 2026, which tools are purpose-built for product-level visibility, and how to evaluate them against your platform mix and growth stage.
Key Takeaways
- SKU-level analytics tracks individual product performance—sales velocity, margin, return rates, availability—rather than aggregated store data
- GA4 and most general tools lack native SKU profitability views; DataHawk, Conjura, Glew, Triple Whale, and Improvado fill that gap
- Tool choice depends on your channel mix: marketplace, DTC, or multi-channel each require different core capabilities
- Evaluate tools on cost modelling depth, platform integrations, real-time alerting, and cross-team usability
- India's Quick Commerce brands need pincode-level SKU availability and fill rate tracking, which most global tools don't support
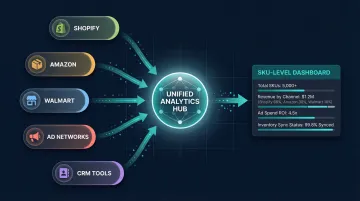
What Is SKU-Level Analytics in Ecommerce?
SKU-level analytics is the practice of tracking performance metrics for each individual product independently—sales volume, conversion rate, return rate, contribution margin, and availability—rather than viewing categories or stores as a whole. Instead of knowing "Dairy revenue is down 11%," you know "the 500ml full-cream pouch has a 40% out-of-stock rate on Blinkit in Bengaluru, costing an estimated ₹2.4L in monthly lost sales."
That gap matters more in 2026. Brands now operate across multiple Quick Commerce platforms simultaneously — Blinkit, Zepto, Swiggy Instamart, JioMart — each with different fee structures, return rates, and dark store coverage. A SKU generating strong sell-through in one city can silently bleed margin in another due to platform fees and high return costs. Without SKU-level visibility, bad decisions compound until the next finance review catches them.
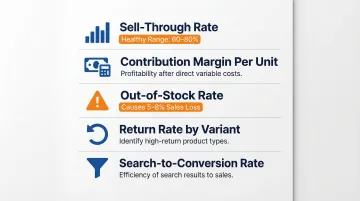
Core SKU-level metrics tracked:
- Sell-through rate: Tracks units sold ÷ units received × 100; a healthy range sits between 60-80%
- Contribution margin per unit: Net of COGS, platform fees, shipping, and return costs — the only margin number that actually matters
- Out-of-stock rate: Even brief unavailability costs 5-8% of potential sales and suppresses platform ranking
- Return rate by variant: Especially critical for personal care and packaged food SKUs where damage-in-transit spikes
- Search-to-conversion rate: Reveals which SKUs get found but fail to close — often a listing quality or pricing signal
On Quick Commerce platforms specifically, availability rate and **dark store fill rate at the pincode level** become essential signals. A product fully stocked in one neighbourhood may be completely invisible 3km away, directly impacting rank and conversion.
Top SKU-Level Analytics Tools for Ecommerce in 2026
We evaluated tools based on depth of product-level reporting, platform integration coverage, AI capabilities, and usability for teams managing large multi-SKU catalogs. These tools are primarily built for Amazon, Shopify, and Western ecommerce platforms — brands operating on Indian quick commerce platforms like Blinkit or Zepto will typically need to layer these with custom data pipelines or native platform exports.
DataHawk
DataHawk is a marketplace analytics platform built specifically for Amazon and Walmart sellers, providing daily SKU-level performance data including sales estimates, ad metrics, keyword rank, and inventory signals through official partner integrations.
Standout capability: DataHawk's digital shelf analytics go beyond sales numbers. The platform tracks keyword visibility, share of voice, and competitor price/availability changes at the SKU level, enabling brands to respond to catalog threats before they impact revenue. White-label dashboards and AI-powered daily alerts make it especially valuable for agencies and enterprises managing large product catalogs across multiple marketplace accounts.
| Category | Details |
|---|---|
| Best For | Enterprise and agency teams managing large Amazon and Walmart catalogs who need daily SKU-level visibility and competitive benchmarking |
| Key SKU Features | Daily sales estimates by SKU, keyword rank tracking, share of voice monitoring, inventory alerts, AI anomaly detection per product |
| Pricing | Custom annual pricing based on business scale; verify current pricing directly with DataHawk |
Conjura
Conjura is a profit-first ecommerce analytics platform built for DTC and omnichannel brands. It operates on the premise that SKU-level revenue data alone is insufficient — you need contribution margin per product after accounting for COGS, shipping, returns, platform fees, and discounting.
Standout capability: Conjura's SKU-level profitability modeling reveals which "hero products" are quietly eroding margin once fulfillment costs and return rates are factored in. Its Owly AI agent lets non-technical users ask plain-language questions like "Why did margin drop for Product X last month?" and receive breakdowns by channel, return rate, and cost driver — making it a decision tool, not just a reporting dashboard.
| Category | Details |
|---|---|
| Best For | DTC and omnichannel brands (Shopify, Amazon, retail) needing SKU-level contribution margin visibility alongside marketing performance |
| Key SKU Features | SKU-level margin after COGS, shipping, fees, and returns; omnichannel product performance; AI-driven anomaly detection; inventory-linked signals |
| Pricing | Tiered plans available; verify current pricing on the Conjura website |
Glew
Glew is a business intelligence platform for mid-market ecommerce brands, connecting to major platforms (Shopify, BigCommerce, WooCommerce) and surfacing product-level performance data including margins, inventory health, and customer purchase patterns by SKU.
Standout capability: Glew's strength is breadth — over 170 integrations and hundreds of pre-built dashboards spanning product, customer, and marketing analytics. For brands that need to correlate SKU-level sales data with customer lifetime value and channel attribution in one place, Glew provides a practical unified view without requiring a dedicated data team to configure it.
| Category | Details |
|---|---|
| Best For | Mid-market ecommerce teams wanting broad product-level and customer analytics across multiple platforms without custom data engineering |
| Key SKU Features | Sales and margin by SKU, inventory performance, product-level LTV correlation, automated product performance reports, channel profitability breakdown |
| Pricing | Free trial available; paid plans from $249/month (USD); verify current pricing on the Glew website |
Triple Whale
Triple Whale is a DTC-focused analytics platform built around Shopify, consolidating advertising, revenue, and profitability data in one dashboard. Its proprietary Triple Pixel enables first-party attribution, showing which SKUs are driven by which campaigns and at what true profitability.
Standout capability: Triple Whale's SKU-level profitability view integrates ad spend, operational costs, and return data to surface which products are genuinely profitable versus which only appear profitable on gross revenue. Its Moby AI layer and Marketing Mix Modeling support help performance-marketing-heavy brands optimize budget allocation at the product level.
| Category | Details |
|---|---|
| Best For | Shopify-native DTC brands and agencies needing SKU-level attribution, profitability tracking, and daily performance visibility without complex data stacks |
| Key SKU Features | Attribution by SKU via Triple Pixel, profitability per product after ad costs and returns, CLV by first product purchased, inventory-linked alerts |
| Pricing | Free tier available; paid plans start from $149/month (USD); verify current pricing on the Triple Whale website |
Improvado
Improvado is a marketing intelligence and data aggregation platform connecting 500+ data sources — including ecommerce platforms, marketplaces, ad networks, and CRM tools — into a unified governed dataset. It enables SKU-level reporting by standardizing fragmented product data across channels into a single model.
Standout capability: Improvado's value for SKU analytics lies in its data infrastructure layer. Brands operating across Shopify, Amazon, Walmart, and ad platforms can build product-level views that pull sales, ad performance, and revenue data by SKU from all sources simultaneously. Its AI Agent allows analysts to generate SKU-level dashboards via natural language, cutting manual data assembly time.
| Category | Details |
|---|---|
| Best For | Large ecommerce brands and agencies with complex multi-platform data stacks needing a governed, unified dataset to power custom SKU-level reporting |
| Key SKU Features | Cross-platform SKU data aggregation, standardised product performance schemas, AI-generated product dashboards, custom connector support, automated pipeline management |
| Pricing | Enterprise pricing on request; review current tiers on the Improvado website |
Key Features to Look for in a SKU-Level Analytics Tool
Depth of product-level cost modelling: The most important differentiator. A tool must go beyond revenue per SKU to model contribution margin—accounting for COGS, platform fees, shipping tiers, discount depth, and return rates per product. If this data lives only in a finance spreadsheet separate from your analytics platform, you're operating with fragmented insight.
Real-time availability and inventory signals: For brands on Quick Commerce platforms or marketplaces, a product's out-of-stock rate directly determines its search rank and conversion potential. Look for tools that surface SKU-level availability alerts. For Quick Commerce specifically, pincode-level demand visibility and dark store fill rate tracking are critical capabilities. For brands managing multi-city Quick Commerce operations, this is where an operator like PickQuick becomes relevant — their platform tracks real-time availability and Min-Max optimisation across 10,000+ pincodes, providing the ground-level data layer that most standalone analytics tools don't cover.
Cross-channel SKU attribution: If a product is sold on both a DTC site and a marketplace, attribution should tell you which channel drove which sale, at what acquisition cost, and at what margin. Tools that only attribute at the campaign level without product-level breakdown miss the key question: which SKU is worth scaling on which channel?
AI-powered anomaly detection and alerts: Manual monitoring of large SKU catalogs isn't scalable. Look for tools that automatically surface performance anomalies—a sudden drop in SKU conversion rate, an inventory depletion risk, or a margin deterioration—and explain the probable cause. This is the difference between a reporting tool and a decision system.
Integration coverage and data governance: The tool must connect cleanly to the platforms your business actually uses. Verify integration quality, not just quantity. For ecommerce brands in India operating on Blinkit, Zepto, Swiggy Instamart, and JioMart, check whether the tool has native or API-based connectors for these platforms—or whether you'll need a third-party data layer to bridge the gap.
How We Chose These Tools
Not all analytics tools are built for product-level commerce decisions. We assessed each tool against five criteria relevant to brands operating across Quick Commerce and multi-channel ecommerce:
- SKU-level reporting depth — especially contribution margin, return rates, and platform-wise availability
- Platform integration coverage — including Blinkit, Zepto, Swiggy Instamart, JioMart, and traditional marketplace channels
- AI and alerting capabilities — proactive signals, not just reactive dashboards
- Usability for non-technical teams — category managers and ops leads should be able to work independently
- Fit across business sizes and channel mixes — from single-city operators to multi-region brand portfolios
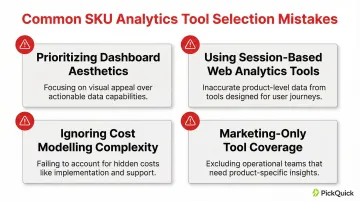
Common mistakes brands make when selecting analytics tools:
- Over-weighting dashboard aesthetics over analytical depth
- Picking tools built for session-based website analytics rather than SKU-level commerce decisions
- Ignoring cost modelling complexity—missing return costs, platform fees, discount impact
- Tools that only serve the marketing team, leaving finance, operations, and merchandising working off separate data
Before signing any contract, write down the five questions your team most urgently needs answered about SKU performance — things like which SKUs are draining margin on Blinkit, or where stockouts are costing you search rank on Zepto. Then test whether each shortlisted tool answers those questions clearly within 15 minutes, without help from anyone outside your team. If it can't, the tool isn't ready for daily operational use.
Conclusion
In 2026, brands that track contribution margin, availability, and attribution at the individual SKU level make faster, more profitable decisions than those relying on aggregate dashboards. The tools reviewed here serve different contexts, from marketplace-first brands to DTC operators to enterprises with complex multi-channel stacks.
Choose a tool that aligns with your actual operating environment—not just your current channel mix. If you plan to scale to new geographies or Quick Commerce platforms, verify the tool supports those channels before committing.
For FMCG and regional brands scaling across Blinkit, Zepto, or Swiggy Instamart, the analytics layer is only as useful as the operational execution behind it. PickQuick manages catalog, replenishment, and dark store operations across 10,000+ pincodes for category-leading brands in India—so the visibility your analytics tool provides translates into action rather than unanswered alerts. Reach out to the PickQuick team to explore how dedicated Quick Commerce operations management supports faster, more profitable growth.
Frequently Asked Questions
Frequently Asked Questions
What are some ecommerce analytics tools?
Ecommerce analytics tools generally fall into four categories: general web analytics (GA4), product/SKU analytics (Conjura, Glew, DataHawk), marketplace intelligence platforms (DataHawk, Helium 10), and enterprise data aggregation tools (Improvado, Adobe Analytics). The right choice depends on whether you need site behaviour data, product-level profitability, or Quick Commerce platform visibility.
What are the key performance indicators for e-commerce?
Core ecommerce KPIs include conversion rate, average order value (AOV), customer lifetime value (LTV), return rate, and gross/contribution margin. At the SKU level, key indicators also include sell-through rate, out-of-stock rate, and margin per product after fees and returns.
What is SKU-level analytics in ecommerce?
SKU-level analytics tracks performance metrics for each individual product variant independently—including sales velocity, margin, return rate, and availability—rather than viewing the store or category as a whole. This granularity enables smarter pricing, inventory, and marketing decisions.
How do I track SKU performance on Quick Commerce platforms like Blinkit or Zepto?
Most global analytics tools don't offer native Quick Commerce platform integrations. Tracking SKU performance on Blinkit, Zepto, or Swiggy Instamart typically requires platform-native dashboards, API-based data pulls, or partnering with a Quick Commerce operator that provides built-in availability and sales tracking at the pincode level.
What metrics should I monitor at the SKU level?
The most important SKU-level metrics to track are:
- Sales velocity and out-of-stock rate
- Contribution margin per unit (after COGS, fees, and returns)
- Search-to-conversion rate and return rate by variant
- Advertising cost per sold unit by SKU
On Quick Commerce channels, availability rate is especially critical — stockouts directly affect platform rank and future visibility.
How does SKU-level data improve inventory management?
SKU-level sales velocity and out-of-stock data enable more accurate Min-Max threshold setting, reduce overstock and stockout risk, and help brands prioritise replenishment for high-velocity products before they lose rank or sales on platforms.