Introduction
Quick commerce in India is no longer just about fast delivery—it's a data war. The brands winning on Blinkit, Zepto, and Swiggy Instamart aren't the ones with the best products or the biggest marketing budgets. They're the ones who understand what the numbers are telling them.
Most regional brands have access to platform dashboards — GMV, order volumes, basic sales reports. But very few know which metrics actually drive growth, or how to read the signals hidden in availability rates and search rankings.
The result? Ad spend wasted on out-of-stock products, expansion stalled by poor replenishment discipline, and opportunities handed to competitors who've mastered the analytics game.
This guide covers the complete analytics framework for quick commerce — which metrics matter, how to act on them, and what separates brands that scale from those that stall. If you're managing a dairy, masala, staples, or personal care brand across Blinkit, Zepto, or Swiggy Instamart, this is your playbook.
Key Takeaways
- Track availability, search rank, conversion, and ad efficiency—not just GMV
- Master four analytics types: descriptive, diagnostic, predictive, and prescriptive
- Availability rate is your foundation: poor availability kills organic rank before ads can compensate
- Platform-specific intelligence matters: Blinkit, Zepto, and Instamart each have distinct assortment and ranking logic
- Consolidating analytics across platforms is the biggest execution gap for most brands
What Is Quick Commerce Analytics and Why It Matters
Quick commerce analytics is the systematic collection and interpretation of data from QC platforms—covering inventory, sales, search performance, and ad spend—to make faster, smarter operational and commercial decisions. It's the difference between guessing why sales dropped and knowing exactly which dark stores went out of stock, which keywords lost rank, and which pincodes need immediate replenishment.
Why QC Analytics Is Fundamentally Different
Traditional e-commerce analytics operates on centralized warehouses and multi-day delivery windows. Quick commerce compresses everything. Time horizons shrink from days to hours. Dark store inventory is finite and hyper-local. A product out of stock for even a few hours can tank search rankings and conversion rates on that platform.
The algorithmic penalties are severe. Blinkit actively demotes brands that drop below an 80% fill rate, reducing search visibility and ad placement. A 24-hour stockout can take 2-3 weeks of elevated ad spend to recover the lost organic ranking position.
The India-Specific Context: Pincode-Level Intelligence
India's quick commerce landscape runs through dense networks of micro-fulfillment centers, each serving a 2-3 km radius zone. Platform scale as of FY25:
- Blinkit: 1,000–1,750 dark stores
- Zepto: 900–1,000 dark stores
- Swiggy Instamart: 1,021 stores
Each store serves distinct pincode clusters with dramatically different demand patterns. That scale is what makes recovery costs so steep when availability breaks down.
The same brand can show 95% availability in one pincode and 60% in another. City-level averages mask up to 21% of recurring stockouts at the hyperlocal level. Blended metrics hide the problem entirely. Pincode-level analytics aren't optional—they're the only lens that shows where revenue is actually leaking.
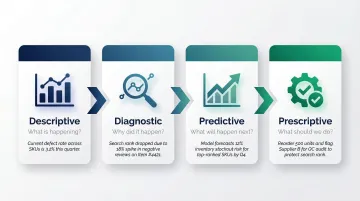
The Four Types of Analytics Applied to Quick Commerce
Quick commerce requires all four types of analytics working together. Each answers a different strategic question. Most brands stop at descriptive analytics—they see what happened but don't understand why, can't predict what's next, and lack clear guidance on what to do.
Descriptive Analytics: What Is Happening Right Now?
Descriptive analytics is the baseline layer: real-time sales data, availability status across dark stores, order volume by SKU, and GMV by platform or city. This is what most QC platform dashboards provide—they tell you what happened, not why.
Key descriptive metrics include:
- Daily order volumes by SKU and platform
- GMV by city cluster and pincode
- Availability percentage across dark stores
- Current search rank positions for category keywords
- Ad spend and impressions by campaign
Descriptive data is the starting point, not the finish line. Without the next layer, you can't act on what you're seeing.
Diagnostic Analytics: Why Did It Happen?
Diagnostic analytics is the root cause layer. It identifies why a SKU's sales dropped—was it an out-of-stock event? A competitor promotion? A search rank drop? Why did ROAS decline in a specific pincode cluster?
This requires cross-referencing availability data with ad spend and rank data. Two scenarios illustrate why this matters:
- Sales drop 40% in Bangalore, availability holds at 95%: the issue isn't inventory — it's search visibility or a competitor taking share
- Availability drops to 65%, ad spend unchanged: you're burning budget on products customers can't buy
Connecting these signals across platforms is what separates brands that react within hours from those that troubleshoot for weeks.
Predictive Analytics: What Will Happen Next?
Predictive analytics uses historical sales velocity, seasonality patterns, and demand signals to forecast replenishment needs. This is critical in QC where dark stores have limited shelf space and overstock is as costly as stockout.
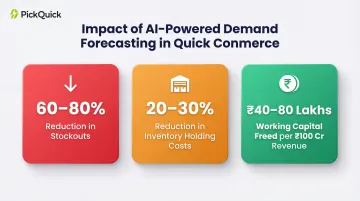
AI-powered demand forecasting in India's FMCG sector can predict SKU-level demand with 85-92% accuracy, compared to 30-45% error rates from traditional spreadsheet forecasting. The business impact is quantifiable:
- 60-80% reduction in stockouts
- 20-30% reduction in inventory holding costs
- ₹40-80 lakhs in working capital freed per ₹100 crore in revenue
In practice, this means knowing three days in advance that a Pune dark store needs a 200-unit top-up on your 500g SKU — before a stockout ever hits your availability metrics.
Prescriptive Analytics: What Should We Do?
Prescriptive analytics is the most advanced layer. Where predictive analytics forecasts, prescriptive analytics recommends: adjust Min-Max levels for a SKU, increase ad bids in a pincode where search rank is slipping, or expand assortment in a city showing rising category demand.
A regional masala brand, for example, might receive a system-generated recommendation to increase Blinkit ad bids in Hyderabad after detecting a 12% rise in category search volume — before that window closes. That speed of response is what separates brands that grow QC revenue predictably from those chasing last week's numbers.
Key Metrics Every Brand Must Track on QC Platforms
Not all metrics are equal. Some are vanity, some are operational, and some are directly causal to growth. The right framework groups metrics into three categories: Availability, Visibility, and Monetization.
Availability Metrics
Availability rate measures what percentage of time your SKUs are live and buyable on the platform. Fill rate tracks the percentage of orders fulfilled without cancellation. These are the foundation metrics. Low availability suppresses organic search rank, triggers platform penalties, and makes ad spend inefficient.
Blinkit requires brands to sustain a fill rate above 90%. Dropping below 80% consistently triggers algorithmic demotion — search rankings drop, ad visibility shrinks, and the platform may remove your listing from active pincodes entirely.
Recovering from this penalty takes weeks of consistent performance above 80%, plus elevated ad spend to rebuild lost position.
Benchmark target: Aim for 95%+ availability across your core pincode clusters. Anything below 85% is a red flag that will throttle growth.
Visibility Metrics
Strong availability directly feeds your discoverability — and that's where visibility metrics take over.
Share of search measures how often your brand appears in category search results. Search rank position tracks where you appear for terms like "oats," "masala," or "milk." Click-through rate (CTR) shows how many users click your listing once it appears.
QC platform ranking algorithms weight three signals heavily: fill rate consistency, conversion rate, and order velocity history. If your availability drops, your organic rank follows within days. Competitors who maintain better availability will climb above you even if your historical sales were stronger — the algorithm rewards current performance, not past.
Monetization Metrics
The three monetization metrics to track:
- ROAS — measures ad efficiency across Blinkit Ads, Zepto Ads, and Swiggy Instamart promotions
- Conversion rate — tracks how many product page views convert to completed orders
- Repeat purchase rate — measures brand stickiness in a channel driven by both impulse and habit
Repeat purchase rate is particularly powerful in QC. Swiggy Instamart reports that its Q4FY23 user cohort spent 1.51x more by their 9th quarter, while Zepto Pass subscribers exhibit a 65% repeat purchase rate. For high-frequency categories like dairy and masala, repeat buyers compound revenue in a way that new customer acquisition simply cannot.
Critical insight: Track metrics at the pincode or dark store level, not just city or national level. The same brand can have 95% availability in one cluster and 60% in another. Blended metrics hide the problem.
How to Build a Data-Driven Quick Commerce Strategy
Having metrics isn't enough. A data-driven QC strategy requires a systematic process of collecting, interpreting, and acting on data in a closed loop.
Step 1: Establish a Baseline Across Platforms
Audit your current performance across each platform—Blinkit, Zepto, Swiggy Instamart—separately. Establish baseline availability rate, search rank for your top 3-5 category keywords, current ROAS, and top-performing SKUs by city.
Without this baseline, you have no way to know if changes are working. Document where you are today before you try to improve.
Step 2: Identify Pincode-Level Demand Gaps
Demand is hyper-local on QC platforms. A brand strong in offline retail in a specific city may have very low QC availability in the pincodes where its core customers live.
Pincode-level demand data reveals where to prioritize dark store coverage and replenishment investment. If you're seeing strong sales velocity in 10 pincodes but weak availability in 20 adjacent pincodes with similar demographics, those 20 are your immediate expansion targets.
Step 3: Connect Inventory Data to Ad Decisions
The most expensive mistake brands make: running ads for SKUs that have low availability. Ads drive clicks—but if the product is unavailable, the click is wasted and the algorithm may deprioritize the listing.
Between 5% and 12% of retail media budgets are wasted advertising out-of-stock products. In quick commerce, where delivery promises are measured in minutes, advertising an unavailable product not only wastes spend but actively damages brand perception.
A data-driven strategy means managing availability and ad spend together, not independently. Real-time availability tracking combined with consolidated ad management across platforms is what prevents this waste and protects ROAS.
Step 4: Use Diagnostic Data to Iterate Assortment
Sales data, return rates, and search query data reveal assortment gaps—SKUs customers are searching for but not finding, or SKUs with high views but low conversion (a listing quality signal).
Run monthly assortment reviews using platform analytics. Key questions to answer each cycle:
- Which SKUs are driving repeat purchases?
- Which are sitting in dark stores with low velocity?
- Which category terms are customers searching for that you don't carry?
Step 5: Set Up a Reporting Cadence
Establish a weekly and monthly reporting rhythm. Weekly reviews should cover availability and ad performance alerts. Monthly reviews go deeper: rank movement, city-level growth, and repeat rate trends.
Brands managing multiple platforms need a consolidated view, whether through a dashboard tool or a QC operator. Fragmented data spread across three separate platform dashboards creates blind spots and slows decisions.
Common QC Analytics Mistakes and How to Avoid Them
Mistake 1: Tracking GMV Without Tracking Availability Rate
GMV growth can mask a deteriorating availability situation. Your sales might be growing overall while availability in key pincodes is declining, setting up a future cliff. When availability drops below platform thresholds, the algorithmic penalties hit quickly — search rank collapses, ad efficiency plummets, and growth stalls.
Fix: Track availability alongside revenue at all times. If GMV is up but availability is trending down, you're building on a weak foundation.
Mistake 2: Treating All Platforms as Identical
Blinkit, Zepto, and Swiggy Instamart have different category dynamics, customer demographics, and ad auction mechanics. A strategy optimized purely for one platform's data will underperform on others.
Platform-specific differences include:
- Blinkit prioritizes availability and replenishment stability above velocity
- Zepto attracts a younger demographic and shows strong performance in Tier-2 cities
- Swiggy Instamart benefits from food ecosystem cross-sell and shows excellent repeat behavior for masalas and cooking accompaniments
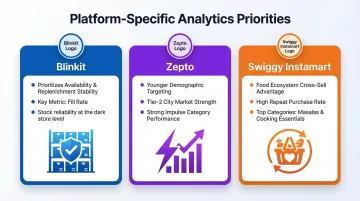
This also means your analytics setup needs to be platform-native — the same dashboard metrics won't tell the same story across all three.
Mistake 3: Ignoring Repeat Purchase Rate in Favor of Acquisition Metrics
In QC, customer lifetime value is built through habits. A customer who orders your masala or dairy product weekly is worth 5-8x more in lifetime revenue than a one-time buyer. Brands that only optimize for first-order conversion miss the retention signal that predicts sustainable growth.
Fix: Track cohort-based repeat purchase rates. Are customers who buy in Month 1 still buying in Month 3? If not, your acquisition strategy isn't building a sustainable business.
The MRP ROAS Trap
Platform dashboards often report ROAS using Maximum Retail Price (MRP) rather than the actual discounted selling price. A product with an MRP of ₹500 and an actual selling price of ₹340 will look 47% more efficient on these dashboards than it actually is.
Fix: Before scaling ad spend, recalculate ROAS based on net transaction value. Platform-reported ROAS should be a starting point, not a decision signal.
Frequently Asked Questions
What does an ecommerce data analyst do?
An ecommerce data analyst collects and interprets sales, traffic, and behavioral data from online platforms to identify growth opportunities, diagnose performance issues, and support data-driven decisions. In quick commerce specifically, this includes tracking availability, ad performance, and search rank across platforms at the pincode level.
What are the 4 types of data analytics?
The four types are descriptive (what happened), diagnostic (why it happened), predictive (what will happen), and prescriptive (what to do about it). In quick commerce, all four apply in sequence: descriptive shows your availability and sales data, diagnostic identifies why performance dropped, predictive forecasts replenishment needs, and prescriptive drives actions like Min-Max adjustments or ad spend reallocation.
What are the most important metrics to track in quick commerce?
The core metric set includes availability rate, fill rate, share of search, ROAS, conversion rate, and repeat purchase rate. Pincode-level granularity makes these metrics significantly more actionable—tracking city-level averages hides the localized problems that kill growth.
How is quick commerce analytics different from traditional ecommerce analytics?
Quick commerce operates on compressed time horizons (hours, not days), dark store inventory constraints, hyperlocal demand signals, and a direct link between availability and algorithmic search rank. A stockout on Amazon might reduce sales; a stockout on Blinkit triggers algorithmic demotion that takes weeks to recover.
How can a brand improve its availability rate on Blinkit or Zepto?
The key levers are better demand forecasting, faster dark store replenishment cycles, and Min-Max optimization by SKU and location. Clean GRN/DN records, healthy motherhub inventory, and fast RO confirmation all directly support consistent availability.
How do I track my brand's performance across multiple QC platforms in one view?
Most platform dashboards are siloed, so brands need either a third-party analytics tool or an end-to-end QC operator that aggregates data across platforms. PickQuick's Quick Commerce Control Tower provides unified visibility across Blinkit, Zepto, Swiggy Instamart, and JioMart by pincode, store, and platform in one view.
The brands scaling fastest on Blinkit, Zepto, and Swiggy Instamart share one thing: systematic, pincode-level data processes that move faster than the competition. Build the right analytics framework, fix the visibility gaps, and growth follows from the decisions you can finally make with confidence.