Introduction
A masala brand can be live on Blinkit city-wide, yet completely invisible to customers in specific neighbourhoods—not because of listing issues, but because the dark store serving that pin code ran out of stock. This is the hidden gap between city-level presence and pin-code level execution that kills Quick Commerce GMV.
Demand on QC platforms is hyper-local. Two pin codes within the same city can have wildly different order volumes, product preferences, and stockout frequencies. Brands managing inventory at the city or zone level end up over-stocking slow pin codes while running dry in high-demand ones. The result is cash locked in the wrong locations and lost sales in the right ones — simultaneously.
What follows is a practical breakdown of pin-code level analytics: what it is, how it surfaces the specific dark stores and zones dragging down your availability, and how to act on it to protect GMV across Blinkit, Zepto, and Swiggy Instamart.
Key Takeaways
- Pin-code level analytics breaks down demand, availability, and sales data to individual postal codes—the smallest unit of actionable insight for QC inventory
- Without it, brands waste capital over-stocking low-demand pin codes while losing revenue in high-velocity ones
- The process covers mapping coverage, segmenting by demand velocity, setting per-pin-code Min-Max thresholds, and acting fast on replenishment signals
- Brands using pin-code data consistently see higher in-stock rates, lower dead inventory, and stronger search visibility in high-demand zones
- QC operators like PickQuick manage 10,000+ pin codes across India, using this data layer to drive replenishment and availability across Blinkit, Zepto, Swiggy Instamart, and JioMart
What Is Pin-Code Level Analytics?
Pin-code level analytics is the practice of breaking down product demand, stock availability, and sales performance data to the level of individual 6-digit PIN codes (Postal Index Numbers). Each PIN code maps to the catchment area of a single dark store on platforms like Blinkit, Zepto, and Swiggy Instamart.
City-level or zone-level tracking misses this granularity entirely. Bengaluru alone has dozens of active dark stores, each serving a distinct set of PIN codes with different demand profiles. A masala brand might sell three times more units per day in a tech-heavy neighbourhood than in a residential suburb — city averages flatten that difference; PIN-code data surfaces it.
Key insights unlocked:
- Tracks whether your product is in stock when customers search in that specific catchment
- Measures how fast stock moves in each dark store's zone, so you can size inventory accurately
- Flags replenishment lag — the gap between a stockout and the next successful refill
Why Pin-Code Level Analytics Is Critical for Quick Commerce Inventory
Algorithmic Penalties for Stockouts
QC platforms algorithmically suppress out-of-stock products in search results. A stockout in a dark store damages the brand's ranking in that pin code's search results—so the revenue hit extends well past the outage itself.
Blinkit requires a sustained 90%+ fill rate; dropping below 80% triggers algorithmic demotion, reducing search ranking and active pin-code coverage. On Zepto, a two-day stockout can set back search placement by weeks.
Precision Stock Allocation
Without pin-code data, brands default to uniform replenishment across all dark stores. This leads to:
- Overstock in low-demand pin codes — tying up working capital in slow-moving inventory
- Chronic stockouts in high-velocity pin codes — losing sales where demand is strongest
Pin-code analytics enables demand-weighted allocation—directing inventory where it will actually move.
Why City-Level Averages Miss the Point
Traditional city-level demand averages mask significant local variation. A dairy brand might see concentrated morning demand spikes in specific residential pin codes that simply don't show up in aggregate data. Pin-code level data makes these micro-patterns visible and forecastable.
Enhanced Customer Experience and Retention
Customers on QC platforms don't wait. 70% of shoppers will switch to a competing brand when their preferred product is unavailable, and 50% will switch to a competing platform. Consistent availability in high-demand pin codes directly drives repeat purchase rates and platform search rankings.
Operational Cost Efficiency
Pin-code analytics helps avoid the twin costs of excess inventory (storage, expiry risk, markdowns) and emergency replenishment (rush dispatches, priority logistics fees). Brands can plan replenishment cycles based on actual pin-code-level demand patterns rather than guesswork.
How Pin-Code Level Analytics Works – Step by Step
Pin-code analytics runs through six operational stages. Each builds on the last — skip one, and the downstream decisions lose their precision.
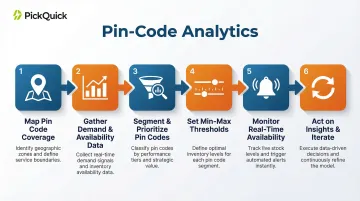
Step 1 – Map Your Pin Code Coverage
Identify every active dark store serving your brand's listings across each QC platform and map the pin codes each store covers. This defines your operational footprint and is the baseline for all further analysis.
Getting this mapping right surfaces coverage gaps before they become missed-demand problems.
Step 2 – Gather Demand and Availability Data
Collect order volume, search impression data, availability rate (percentage of time the product was in-stock when searched), and stockout frequency for each pin code across platforms.
Many brands skip data collection for smaller pin codes assuming the volume doesn't justify it. That's exactly where undetected demand spikes live.
Metrics impacted: Data completeness, demand signal accuracy
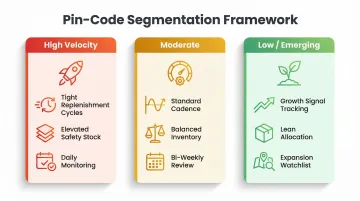
Step 3 – Segment and Prioritize Pin Codes
Classify pin codes into demand tiers based on order frequency and availability data. The most common mistake at this stage is skipping segmentation entirely and applying uniform replenishment rules across all pin codes — which eliminates the advantage of hyperlocal analytics.
- High velocity — Need tighter replenishment cycles and higher safety stock
- Moderate — Standard replenishment cadence with balanced inventory
- Low/emerging — May indicate new demand pockets worth investing in
Step 4 – Set Min-Max Thresholds by Pin Code
Define minimum and maximum stock levels for each product at each dark store based on the demand tier of the pin codes it serves. A dark store covering a dense residential area like Indiranagar or Bandra will need a substantially higher minimum threshold for a dairy SKU than one serving a peri-urban zone with lower order frequency.
Metrics impacted: Stockout rate, overstock rate, working capital efficiency
Step 5 – Monitor Real-Time Availability and Flag Gaps
Track live availability rates by pin code across platforms and set alerts when stock falls below the minimum threshold.
For fast-moving categories — dairy, masala, beverages — weekly checks are insufficient. Daily monitoring is the floor; near-real-time alerts are the standard for protecting search rankings.
Metrics impacted: In-stock rate, replenishment lead time, search ranking protection
Step 6 – Act on Insights and Iterate
Use pin-code-level availability trends to drive replenishment dispatch decisions, adjust Min-Max thresholds seasonally, and identify pin codes where demand is growing (warranting expanded assortment) or declining.
Loop insights back into demand forecasting for the next planning cycle. This is what separates brands running reactive replenishment from those building a compounding availability advantage.
Pin-Code Analytics in Action: A Quick Commerce Case Walkthrough
The Scenario
A regional masala brand is live on Blinkit across a metro city but experiencing stagnant GMV despite strong offline demand in the same market. Their replenishment is uniform—they send the same quantity to all dark stores on a weekly cycle. They have no visibility into which pin codes are driving orders and which are sitting idle.
The Discovery Phase
When pin-code level data is applied, the picture sharpens fast:
- Three pin codes in a dense residential cluster account for nearly half of all city orders
- Five other pin codes show near-zero traction
- The top three pin codes register out-of-stock for 30–40% of daily search windows
Uniform replenishment has been over-stocking low-demand stores while chronically running short exactly where demand is highest — suppressing platform rankings in the process.
The Intervention
The brand (or their QC operator) reconfigures replenishment:
- Double safety stock at the three high-velocity pin codes
- Cut replenishment cycles from 7 days to 3 days
- Pull back allocation from low-demand dark stores
- Test small assortment expansion in emerging pin codes showing growth signals
One step most brands miss: Min-Max thresholds need seasonal updates. Skip this and the fix holds in Month 1, then quietly drifts back to the old pattern by Month 3.
The Outcome
Within a few weeks of demand-weighted replenishment, availability rates in the high-velocity pin codes recover, platform search visibility recovers, and GMV begins to reflect the brand's actual offline demand potential.
The broader pattern holds across categories. An FMCG conglomerate that began monitoring Blinkit and Zepto at the pincode level uncovered price inconsistencies between platforms, improving regional profitability by 12% in a single quarter. Separately, brands acting on real-time pincode data report up to 15% higher ROAS and 20% faster inventory turnover, according to analysis of Zepto Atom performance data.
How PickQuick Can Help
PickQuick is the QC operator that has already built the pin-code analytics infrastructure at scale: managing 10,000+ pin codes across India and 25+ category-leading brands. Pin-code level demand visibility and real-time availability tracking are core parts of PickQuick's QC management engine—not as an add-on, but as the operational foundation for replenishment decisions across Blinkit, Zepto, Swiggy Instamart, and JioMart.
That infrastructure is directly available to regional brands—masala, dairy, FMCG, personal care—who don't have the in-house capability to run analytics at this granularity.
PickQuick acts as the single operator managing the entire QC division: dark store replenishment, Min-Max optimization, availability tracking, and platform-level search performance. One partner replaces dozens of fragmented vendor relationships, delivering the pincode-level execution that drives consistent availability and GMV growth.
PickQuick's specific advantages relevant to pin-code analytics:
- Operator rights and dark store relationships across multiple cities are already in place—inventory reaches the right pin codes faster, with no setup delays
- Availability data across Blinkit, Zepto, Swiggy Instamart, and JioMart is visible in a single operational view—no platform silos, no blind spots
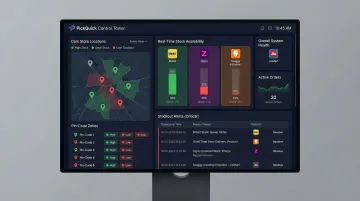
- Quick Commerce Control Tower provides real-time stock and availability tracking at the dark store and pincode level with instant stockout alerts
- 3-5x faster QC go-live compared to independent brand onboarding, enabling rapid expansion into high-demand pin codes
Conclusion
Most brands manage inventory at the city level and wonder why their QC metrics underperform. The answer is almost always granularity—specifically, the absence of it. The platform only rewards brands whose products are consistently in stock when and where customers search—and that requires operating at the pin-code level, not the city level.
As QC platforms deepen their geographic penetration across Tier 1 and Tier 2 India, the pin codes with the highest demand density will only become more competitive. Brands that build pin-code level inventory discipline now—tracking demand signals, correcting dark store gaps, and replenishing proactively—will hold search visibility and conversion rates that city-level operators simply cannot match. PickQuick's operations across 10,000+ pin codes reflect exactly this approach: availability managed where demand actually lives, not where it's assumed to.
Frequently Asked Questions
What is pin-code level analytics in Quick Commerce?
Pin-code level analytics refers to breaking down product demand, stock availability, and order data to the level of individual 6-digit PIN codes—the geographic catchment served by each dark store. This allows brands to make replenishment and inventory decisions based on hyperlocal demand signals rather than city-wide averages.
How is pin-code level data different from city-level or zone-level inventory tracking?
City or zone-level data averages out significant local variation—a single city can have pin codes with 5x the demand velocity of adjacent areas. Pin-code level data surfaces these micro-differences, enabling demand-weighted stock allocation that city-level tracking structurally cannot achieve.
How does a stockout in one pin code affect a brand's overall QC performance?
QC platforms algorithmically reduce search visibility for out-of-stock products. A stockout in a high-demand pin code damages search rankings in that catchment even after stock is restored, slowing recovery and compounding the revenue impact well beyond the outage window.
Which Quick Commerce platforms support pin-code level inventory tracking?
Blinkit, Zepto, Swiggy Instamart, and JioMart all operate a dark store model where inventory is assigned at the store level, mapping directly to specific pin codes. Availability and demand data can be tracked at this granularity through platform dashboards or via a QC operator with integrated cross-platform visibility.
How often should brands review their pin-code level inventory data?
High-velocity categories (dairy, staples, beverages) require daily or near-real-time monitoring. Moderate-velocity FMCG and personal care brands should review at minimum every 2-3 days. Weekly review cycles are too slow for QC's replenishment cadence and will result in availability gaps during peak demand windows.
Can pin-code level analytics help a regional brand identify new cities or areas to expand into on QC?
Yes. Pin-code data reveals emerging demand pockets with growing order volumes but low current supply, letting brands prioritize dark store activation in high-potential areas before expanding broadly. The result is faster city entry with stronger availability from launch.