
The problem isn't the product. It's the fundamental mismatch between geographic demand reality and supply chain assumptions. In Quick Commerce, this gap is more punishing than any other channel because dark stores operate on 10-15 minute delivery windows with limited shelf space. A stockout in one pincode cluster kills conversion for hours while surplus stock three kilometres away sits worthless.
This article covers what geographic demand forecasting is, why geography fundamentally shapes QC supply chains, what signals drive these forecasts, and how brands translate them into smarter replenishment that actually works at the dark store level.
Key Takeaways
- Geographic demand forecasting predicts how much product specific pincodes will need, moving beyond national averages to dark store-level precision
- Regional preferences, urban micro-markets, festivals, and Tier 1 vs. Tier 2 behaviour create demand variations that national models completely miss
- Platforms like Blinkit penalise stockouts with ranking drops—availability below 80% triggers algorithmic demotion across entire pincode clusters
- Forecasts feed directly into Min-Max thresholds per dark store, preventing both stockouts and overstocking in space-limited dark stores
- PickQuick's visibility across 10,000+ pincodes turns demand forecasts into reliable dark store availability — powered by real-time replenishment
What Is Geographic Demand Forecasting?
Geographic demand forecasting is the process of predicting how much of a specific product will be needed, in a specific location, within a specific time window. Unlike national or category-level averages, geographic forecasting operates at city, zone, or pincode level—the granularity required when supply must be positioned in advance at distributed dark stores.
Standard forecasting asks: "How much will we sell nationally this quarter?"
Geographic forecasting asks: "How much will dark store #47 in South Mumbai's Colaba cluster sell in the next 72 hours versus dark store #52 in Andheri West?"
This distinction matters because Quick Commerce platforms don't operate from central warehouses with next-day delivery flexibility. Dark stores serve 2-5 kilometre radius pincode clusters with 10-15 minute delivery promises. Stock in the wrong location is effectively invisible to customers in another pincode—even if that pincode is only 8 kilometres away.
In the QC context, the geographic unit isn't a warehouse region or city. It's the dark store's serviceable pincode cluster (typically 15,000-40,000 households within a tight delivery radius). A brand might have 12 dark stores in Bengaluru alone, each serving distinct demand profiles.
What this means in practice:
- Each dark store covers a fixed pincode cluster, not an interchangeable city zone
- Household density, income mix, and purchase habits vary sharply across clusters
- A Bandra West store and a Dharavi store in the same city can have near-opposite top-SKU lists
- Forecasting at anything coarser than pincode level produces systematic inventory mismatches
Why Geography Changes Everything in Quick Commerce Supply Chains
Regional Preference Variation
India's food and FMCG consumption patterns are fundamentally regional. A spice blend dominant in Tamil Nadu may have near-zero organic demand in Punjab. According to MOSPI's 2023-24 household consumption survey, milk and milk products dominate expenditure in Gujarat, Haryana, Punjab, Rajasthan, and Uttar Pradesh, while in Kerala, egg, fish, and meat hold the highest share. Cereals account for 3% of rural expenditure in Kerala and Punjab but 7% in Bihar and Jharkhand.
Quick Commerce exposes these variations in real time. A ghee brand loved in Rajasthan sees completely different demand curves in Maharashtra. Idli podi and dosai podi sell almost exclusively in Tamil Nadu and parts of Karnataka; thecha masala moves only in Maharashtra.
National inventory plans that average across these regions fail on both ends — understocking high-demand pincodes and overstocking low-demand ones.
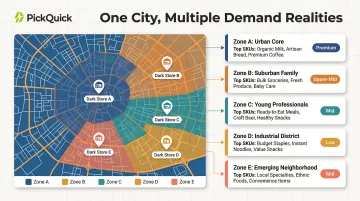
Urban Micro-Market Segmentation Within Cities
Even within a single city, demand patterns vary sharply across dark stores. South Mumbai's consumption profile differs from the western suburbs. Indiranagar in Bengaluru behaves differently from Whitefield. These aren't minor variations—they represent distinct household income levels, age cohorts, dietary patterns, and cultural preferences.
NielsenIQ's 2026 data shows that quick commerce now accounts for 18% of FMCG sales in the top 8 metros, but this penetration varies significantly by pincode. Research indicates that 60% of grocery searches now vary significantly by pincode, influenced by income levels, household size, and regional food preferences. City-level forecasts average out this micro-market variation, producing inventory plans that satisfy no one.
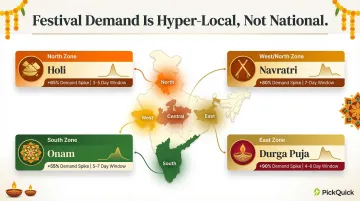
Local Events, Festivals, and Cultural Calendars
Regional festivals create predictable but geographically contained demand spikes that national models miss entirely. During Navratri 2025, Zepto captured 34% of all online grocery orders, but this surge was concentrated in Gujarat, Maharashtra, and specific pincode clusters within those states. Kerala sees predictable Onam-driven spikes. Durga Puja triggers category surges in West Bengal and Odisha—Bigbasket reported 128% growth in pooja essentials during the 2025 festival period.
These aren't gradual national trends. They're hyper-local demand windows lasting 3-7 days in specific geographic pockets. Brands forecasting at city or state level dilute these signals into noise, missing the replenishment urgency required to capture festival demand in the right dark stores at the right time.
Tier 1 vs. Tier 2 Demand Behavior
Metros show higher baseline order frequency, but Tier 2 cities demonstrate sharper category-specific spikes around festive periods. Swiggy Instamart reported that one in four new users in 2025 came from non-metro cities as they expanded to 124 cities. Blinkit scaled to 1,301 stores across 100+ cities, while Zepto plans to reach 700+ dark stores by late 2025, explicitly targeting Tier 2 and Tier 3 expansion.
Tier 2 demand is structurally different, not just smaller in volume. Geographic forecasts need to reflect these behavioral patterns rather than treating Tier 2 as "metro demand at 60%":
- Consumption clusters around weekends and festivals more sharply than in metros
- Category preferences skew toward staples and regional brands over premium variants
- Replenishment windows are shorter and less forgiving during peak periods
Platform Ranking Consequences
All of this geographic complexity ultimately hits one nerve: platform rankings. Blinkit and Zepto rank products partly on availability and fulfillment rate, not just velocity. Blinkit requires brands to sustain fill rates above 90%. Dropping below 80% triggers algorithmic demotion: search rank drops, ad visibility shrinks, and pincodes go dark. Zepto's ranking algorithm considers impressions, user preferences, and add-to-cart actions, but explicitly states they're not responsible for products that are out of stock or unavailable.
A stockout in a specific dark store doesn't just lose that immediate sale. It tanks visibility and conversion for that entire pincode cluster, even if other locations have surplus stock. Geography isn't only a logistics issue — it's a ranking and revenue issue. National inventory plans that ignore pincode-level availability systematically suppress platform performance in high-potential micro-markets.
Key Signals That Drive Geographic Demand Forecasts
Historical Sales Data by Location
Past order volumes by dark store or pincode cluster reveal baseline demand patterns, seasonal rhythms, and week-over-week trends specific to each geography. This is the foundational signal. Brands without pincode-level data are working from averages that hide the structural differences between dark stores.
Velocity isn't uniform across a city. One dark store might move 150 units weekly while another 4 kilometres away moves 40 units. Historical data exposes these structural differences, allowing Min-Max thresholds to reflect reality rather than averaged assumptions.
Demographic and Socioeconomic Data
Several demographic variables shape what categories and SKUs see structural demand in a given geography:
- Population density and household income distribution
- Age cohort mix (the over-45 segment now forms the largest cohort of new online shoppers, per BCG)
- Dietary patterns and category preferences by pincode cluster
A premium dairy variant may index much higher in certain postal zones even within the same city.
These demographic overlays help explain why historical sales patterns exist and predict how they'll evolve. A pincode cluster with high household income and young professionals will show different category preferences and brand elasticity than one dominated by multi-generational families with moderate income.
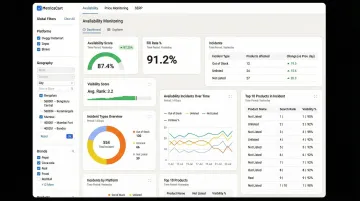
Platform Search and Browse Data
Search volume for a product or category within a specific service area signals latent demand that may not yet appear in sales. Zepto Atom offers live dashboards with minute-level updates and PIN-code level performance maps, priced at ₹30,000 quarterly or 0.5% of previous month GMV. Blinkit's Brand Central provides impressions, add-to-cart, and sales data at the campaign level.
Brands with access to this data can forecast demand in new cities before launching there. High search volume for a category in Tier 2 cities signals expansion opportunity; low search volume despite strong offline presence suggests either awareness gaps or genuine preference differences.
Seasonal and Event-Driven Calendars Mapped to Geography
Building a geographic calendar overlay is critical. Swiggy Instamart recorded over 700,000 orders in a single day during Holi 2024. These spikes are predictable—Holi falls on the same calendar window each year—but geographically concentrated in North India.
Knowing which pincode clusters will spike around local festivals or long weekends allows brands to forward-load inventory into relevant dark stores in advance. Without this geographic calendar, brands either miss the spike entirely or distribute stock nationally, diluting availability in high-demand zones.
Competitor Availability and Pricing Signals by Location
Beyond your own demand patterns, competitor behavior creates its own signal. When a competing brand goes out of stock in a dark store, demand for alternatives spikes. Geographic forecasting models that incorporate competitive availability data allow brands to anticipate and capture this demand shift. If your competitor consistently runs out of stock in specific pincodes on weekends, that's a clear signal—forecast higher demand in those windows and ensure availability when they can't fulfill.
From Forecast to Dark Store: Translating Geography into Replenishment
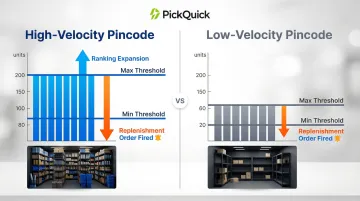
Replenishment Logic: Min-Max Thresholds
Geographic demand forecasts feed directly into Min-Max thresholds at the dark store level. The minimum stock level triggers a replenishment order; the maximum level prevents overstocking in constrained dark store environments. Both thresholds shift over time based on velocity, availability performance, and platform trust signals.
A dark store in a high-velocity pincode cluster might have a Max of 200 units for a popular SKU, while another serving a lower-demand area has a Max of 60 units. If geographic forecasts are accurate and replenishment is reliable, Blinkit's algorithm expands Max levels, allowing higher consumption. Poor forecasting shrinks Max, limiting growth potential.
City-Level Assortment Decisions
Not every SKU needs to be live in every geography. Geographic demand forecasts help brands decide which variants to push in which cities, reducing complexity and improving in-stock rates for SKUs with actual local demand. Tamil Nadu dark stores stock idli podi and dosai podi; Maharashtra stores carry thecha masala. Each stocking decision reflects pincode-level demand signals that justify the shelf space.
Brands that force national assortment strategies onto all geographies dilute availability for high-demand SKUs while wasting shelf space on variants nobody wants locally.
Lead Time Challenges in Quick Commerce
Unlike traditional retail where replenishment cycles can be weekly, dark store stockouts hurt conversion within hours. Zomato's operations report notes inventory replenishment multiple times daily. Swiggy Instamart's delivery times have shrunk to 12.5 minutes. In this environment, geographic forecasts need translation into rolling 3-7 day replenishment plans with buffer stock calibrated to demand volatility in each location.
PickQuick's pincode-level visibility across 10,000+ pincodes bridges raw forecasts and reliable dark store availability through:
- Real-time alerts when stockouts occur at any location
- Replenishment orders triggered directly from pincode-level demand signals
- Threshold adjustments based on consumption patterns as they shift
The Feedback Loop
Actual sales data from each dark store should continuously update the geographic forecast. Brands that treat forecasting as a one-time exercise fall behind local market shifts. Weekly velocity changes, new competitor launches, festival shifts, and weather patterns all affect pincode-level demand. The forecast must evolve with the market—or the replenishment logic built on top of it becomes unreliable.
Common Pitfalls of Ignoring Geographic Demand Signals
Over-Centralizing Inventory Decisions
Brands that stock based on aggregate national or regional averages end up with chronic surpluses in low-demand zones and chronic stockouts in high-demand ones. The financial cost is direct: PwC's working capital analysis flags annual inventory write-offs above 5% of COGS as a warning sign, along with over 5% of inventory ageing past 90 days. India witnesses 4.6-15.9% wastage in fruits and vegetables annually due to poor supply chain infrastructure.
In Quick Commerce, this pattern is especially damaging. Surplus stock in low-demand pincodes ages quickly in dark stores with limited space, triggering platform penalties. Meanwhile, stockouts in high-demand pincodes tank ranking and lock brands out of expansion opportunities—losing both immediate GMV and long-term platform trust.
Treating All Cities in an Expansion Cohort as Identical
Over-centralization at the national level has a parallel at the city level. When launching somewhere new, brands often replicate the assortment and volume of an existing city without adjusting for local demand signals. Zepto suspended operations of 44 cafes across Tier 2 cities like Amritsar, Chandigarh, and Meerut due to supply chain mismatches. Later, Zepto Cafe temporarily closed 200 of 600 stores due to muted demand in select areas.
Replicating the Delhi playbook into Chennai ignores real differences—cuisine preferences, income distribution, brand loyalty, and how locals shop. Pre-launch indicators like search data, demographic proxies, and offline GT demand should shape initial assortment and volume assumptions.
Failing to Separate Structural Demand from Spike Demand
One-time local events—a cricket final, a city-level promotion, a weather anomaly—can inflate historical data and skew future forecasts upward.
If a brand sees 3x normal volume during a regional cricket final and folds that into its baseline, it will systematically overstock in future cycles, tying up capital and shelf space.
Geographic models must tag and separate spike demand from baseline demand. The three demand types behave very differently:
- One-time spikes (cricket finals, flash promotions) — exclude from forward forecasts
- Recurring seasonal demand (festivals, harvest seasons) — model separately with annual cadence
- Baseline consumption — the stable rhythm between spikes; the only number that drives safe Min-Max settings
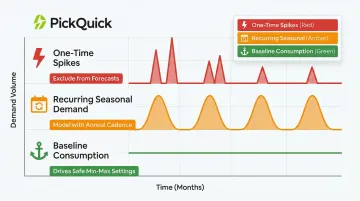
Mixing all three produces forecasts that overshoot reality, creating inventory health problems that shrink Max levels and constrain growth.
Frequently Asked Questions
How do geographical circumstances impact demand forecasting?
Geography shapes demand through regional preferences, cultural calendars, demographic differences, and infrastructure factors. The same product can have vastly different velocity profiles across locations. Forecasts that ignore geography produce systematically skewed inventory plans that overstock some areas while starving others of supply.
What data sources are used for geographic demand forecasting in quick commerce?
Pincode-level sales history from dark stores, platform search and browse data, demographic datasets, regional festive calendars, and competitive availability signals are the key inputs. Together, they map baseline consumption and event-driven spikes for each micro-market.
How does pincode-level demand forecasting improve dark store replenishment?
Pincode-level forecasts allow brands to set accurate Min-Max thresholds per dark store, preventing stockouts that hurt platform rankings and surpluses that eat into margin and shelf space. This precision turns replenishment into a growth lever rather than a reactive process.
What is the difference between city-level and pincode-level demand forecasting?
City-level forecasting averages out micro-market variation, while pincode-level forecasting captures the distinct demand patterns of each dark store's serviceable area. In QC, a single city may have 5-15 dark stores with distinct demand profiles, making pincode-level granularity essential.
How do seasonal and regional factors affect FMCG demand on QC platforms?
Regional festivals, harvest cycles, and local weather patterns create predictable but geographically contained demand spikes. Brands that model these into their replenishment calendar consistently outperform those that react to spikes after they've already hit.
Can regional brands use geographic demand forecasting even if they're new to quick commerce?
Yes. Even without historical QC sales data, regional brands can leverage offline GT/MT sales data, platform category search trends, and demographic proxies to build a starting geographic demand model. Once dark store data starts coming in, the model refines quickly from there.