Introduction
A dark store in Bengaluru's Whitefield tech corridor and one in Pune's Camp market district sit 1,500 km apart—yet both receive the same staffing plan. The result? One dark store burns payroll on idle pickers during a quiet Tuesday morning, while the other collapses under a dinner-hour surge, missing SLA windows and watching its platform ranking plummet.
In 10-minute delivery models, a single understaffed shift doesn't just slow fulfilment—it tanks fill rates, triggers algorithmic penalties, and kills platform visibility.
Demand in quick commerce fluctuates by pincode, time of day, local event, and weather. Yet most brands still rely on city-level averages or historical patterns to staff their dark stores, creating a permanent mismatch between labour supply and order demand.
This guide covers:
- What hyperlocal demand forecasting is and how it works
- Why it outperforms traditional city-level methods
- Which signals matter most for accurate QC forecasts
- How to build a forecast-driven workforce strategy for dark store operations
Key Takeaways
- Hyperlocal forecasting predicts demand at the pincode or store level, not city averages—making it the most accurate input for workforce planning
- Traditional methods miss location-specific spikes from local events, demographics, weather, and promotions, which drives overstaffing costs or service failures
- Key signals: historical order velocity by pincode, time-of-day patterns, event calendars, weather triggers, and real-time platform data
- Accurate forecasts determine how many pickers, packers, and riders each dark store needs per shift, cutting idle labour and preventing stockouts
- Brands using forecast-driven strategies see measurable gains in fill rates, availability scores, and labour cost efficiency
What is Hyperlocal Demand Forecasting?
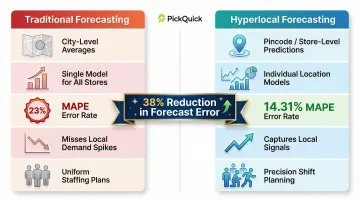
Hyperlocal demand forecasting predicts consumer demand at a granular geographic level (typically down to a specific store, dark store, zone, or pincode) rather than at a city, region, or national level. Traditional forecasting applies broad averages across locations, treating all dark stores in a city as if they face identical demand environments. Hyperlocal models reject this assumption.
Each dark store serves a unique demand environment. A store in a residential IT corridor behaves differently from one in a market district. Research shows that moving from aggregate models to location-level machine learning frameworks can reduce forecast error (MAPE) by up to 38% in high-frequency retail environments — from 23% down to 14.31%.
That accuracy gap matters most when forecasts feed directly into staffing decisions. Hyperlocal forecasting converts demand signals (order volume, SKU velocity, basket size) into specific headcount requirements — answering questions like: How many pickers are needed for the Tuesday 9 PM shift at this pincode? This forms the foundation for labour demand forecasting and shift planning, enabling operators to match staffing to actual demand at the shift and location level.
Why Traditional Forecasting Falls Short for Workforce Optimization
Traditional forecasting methods rely on historical averages and static schedules, assuming future demand will mirror past patterns with small variance. In quick commerce, where demand can spike 3x during a cricket final or flash sale, these models under- or over-estimate at the location level.
A brand managing dark stores across 10 cities cannot apply one forecast model uniformly — yet that's exactly what most operators do. Each pincode has unique demand triggers. As city-level QC data alone is insufficient for commercial decisions, every dark store must be treated as its own inventory and pricing unit.
Aggregated metrics hide the performance gaps that determine stockouts and expansion eligibility. The brands that crack hyperlocal forecasting first are the ones that stop losing ground to pincode-level variance they never tracked.
The Key Demand Signals for Hyperlocal Workforce Forecasting
Historical order and SKU velocity data by pincode
The baseline signal is granular transaction history: order volumes by hour, day, and week broken down to the individual dark store or pincode. This establishes the recurring demand rhythm—morning peaks, weekend spikes, weekday lulls—that underpins any reliable forecast.
Time-of-day and day-of-week patterns
QC demand is highly time-compressed. Orders cluster around breakfast, lunch, and late-evening windows with very different intensity across pincodes depending on neighbourhood type (residential, commercial, mixed).
Workforce plans that ignore hourly granularity will consistently over- or under-deploy staff during critical windows. A dark store serving office workers sees lunch spikes; one in a residential area peaks at dinner. Same city, completely different labour needs.
Local events, festivals, and platform promotions
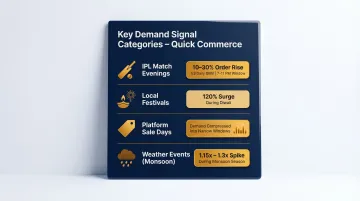
External events are among the highest-impact demand signals in QC:
- IPL match evenings: Orders rise 10-30%, with nearly one-third of daily GMV concentrated in the 7 PM to 11 PM window
- Local festivals: During 2025 Diwali, quick commerce platforms recorded a 120% surge in order volumes. Regional festivals like Navratri, Onam, and Pongal create similar localized spikes
- Platform sale days: Blinkit Big Days and similar promotions compress demand into narrow windows that historical averages can't predict
Integrating a forward-looking event calendar into forecast models lets shift managers increase staffing ahead of the surge—not scramble for staff once orders are already stacking up.
Weather and hyperlocal triggers
Weather is a consistent demand accelerator in QC. During heavy rains, Flipkart Minutes recorded a 1.15x order spike in Delhi and Mumbai, and 1.3x in Jaipur and Lucknow; BigBasket reported 12-15% surges across northwest India in the 2025 monsoon season. Orders for staples, beverages, and snacks spike as consumers stay indoors.
Weather data feeds (rainfall probability by district) can be layered into demand models to trigger staffing adjustments for specific dark stores in affected zones.
Real-time platform signals and inventory data
Three live data streams directly shape how many staff a dark store needs at any given hour:
- Real-time order inflow rates show when actual demand diverges from forecast
- Current inventory levels at a dark store affect picker workload—low stock means fewer picks per order
- Platform visibility (whether a SKU is listed, ranked, or out-of-stock) directly impacts order volume
A Min-Max replenishment model integrated with demand forecasts helps identify when stock depletion will trigger a picker bottleneck, so staffing adjustments happen before order queues back up at the picking station.
How Hyperlocal Forecasting Drives Workforce Optimization in Quick Commerce
Dark store staffing: translating forecasts into shift plans
A hyperlocal demand forecast output for a given dark store and time window—"Saturday 7–10 PM order volume = 320 orders"—translates into a specific labour requirement.
Start by defining an orders-per-hour ratio for each role (picker, packer, rider), then apply it to forecast outputs to generate recommended headcount by shift. For example:
- Picker standard: 15 orders per hour
- 320 orders in 3 hours = 320 ÷ 3 ÷ 15 = ~7 pickers needed
This removes guesswork from shift planning and gives managers a data-backed starting point for scheduling.
Reducing overstaffing and understaffing costs
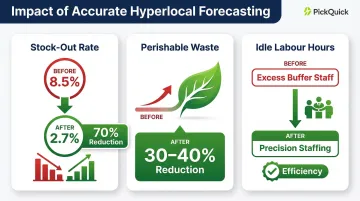
Pincode-level accuracy eliminates the padding operators add to compensate for forecast uncertainty. When a dark store manager can trust the forecast, they stop scheduling buffer staff "just in case," reducing idle labour hours.
A CCT study on ML-driven forecasting found stock-out rates dropped from 8.5% to 2.7%—a 70% reduction—while perishable waste fell 30–40%. Labour follows the same logic: accurate forecasts mean staffing for actual demand, not inflated estimates.
Improving platform availability scores and fill rates
When the right number of pickers are present at the right time, dark stores fulfil orders within SLA windows and maintain high in-stock availability. Cancellation penalties drop as a direct result.
Platform reality: Blinkit expects brands to sustain a fill rate above 90%. Falling below 80% triggers severe algorithmic demotion—search rankings drop, ad visibility reduces, and the platform may remove the listing from active pincodes entirely.
Availability score and fill rate are directly tied to how well labour supply matches order demand across each hour of operation.
Scaling across pincodes without linear cost growth
A brand operating 50+ dark stores across 10 cities can use location-specific models to grow coverage without proportionally growing labour costs. Hyperlocal forecasting enables precision staffing—each dark store gets exactly the labour it needs, calibrated to its local demand pattern.
PickQuick's pincode-level demand visibility and dark store replenishment expertise—built across 10,000+ pincodes—enables this kind of precision staffing across multi-city, multi-platform QC operations without operational friction.
Dynamic reallocation during demand disruptions
Real-time demand signals allow shift managers to reallocate staff within a cluster of dark stores when one location sees an unexpected spike while another is quiet.
For QC operators running multiple micro-fulfilment points in the same city, this live reallocation capability means demand spikes get absorbed without overtime costs or missed SLAs—forecasting that directly protects workforce efficiency at scale.
Building Your Hyperlocal Forecast-Driven Workforce Strategy
Step 1: Establish granular data capture at the pincode level
The foundation is data infrastructure. Brands and operators must ensure that order data, inventory movements, and fulfilment outcomes are tagged to the individual dark store, not aggregated at the city level.
Without this granularity, no forecasting model can generate actionable hyperlocal outputs.
Key systems to connect:
- Warehouse Management System (WMS)
- Platform order feeds (Blinkit, Zepto, Swiggy Instamart, JioMart)
- Replenishment logs
- Inventory tracking systems
Step 2: Build location-specific forecast models with the right signal mix
Each dark store requires its own model trained on its own history and enriched with external signals: events, weather, promotions.
Why AI and ML matter: Manual models for 50 locations are not feasible. Algorithm-based models with automatic retraining can maintain accuracy as demand patterns shift. Platforms like Swiggy Instamart use neural networks and pattern mining to predict demand at the dark store and hour level, incorporating real-time covariates like weather and local events.
Best practice: Implement automatic quality checks and model retraining to detect drift and adjust to new patterns.
Step 3: Convert forecast outputs into actionable shift plans
Define labour standards per role (orders per picker-hour, dispatch rate per packer-shift), then apply these ratios to forecast outputs to generate recommended headcount by shift, role, and location.
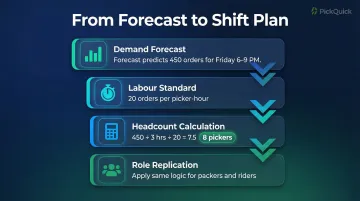
Example workflow:
- Forecast predicts 450 orders for Friday 6–9 PM
- Labour standard: 20 orders per picker-hour
- Calculation: 450 ÷ 3 hours ÷ 20 = 7.5 → schedule 8 pickers
- Apply similar logic for packers and riders
This removes guesswork and gives dark store managers a data-backed starting point for scheduling.
Step 4: Build in review loops and continuously refine
Hyperlocal forecasting is not a one-time setup. Review models against actuals regularly — weekly for fast-moving pincodes, monthly for stable ones — to detect drift and retrain on new patterns.
The review cycle is only as useful as the data feeding it. Operators managing multiple brands across platforms accumulate cross-location signal that individual brands rarely have on their own. PickQuick, for example, manages demand visibility and replenishment across platforms for 25+ regional brands, giving its partners access to consolidated operational data that sharpens forecast accuracy without requiring brands to build internal analytics teams from scratch.
Frequently Asked Questions
What is hyperlocal forecast?
Hyperlocal forecasting predicts demand at the level of a specific location, zone, or pincode—rather than city or regional averages. This allows businesses to make staffing and inventory decisions that reflect the unique demand environment of each individual dark store.
How to forecast workforce demand?
Start by collecting granular historical order data by location and enriching it with external signals — events, weather, and promotions. Apply a forecasting model to produce demand projections, then convert those projections into headcount requirements using defined labour standards per role.
What is the difference between hyperlocal and traditional demand forecasting?
Traditional forecasting uses aggregated or averaged data across many locations, while hyperlocal forecasting trains separate models for each location using that location's own data and local demand drivers. The result is significantly higher accuracy for site-level workforce planning.
What demand signals matter most for quick commerce workforce planning?
The top signals are historical order velocity by pincode, time-of-day and day-of-week patterns, local festivals and platform promotions, weather triggers, and real-time inventory data.
How does hyperlocal forecasting reduce overstaffing costs in dark stores?
When a forecast is accurate at the location and shift level, managers can staff precisely to expected demand rather than adding buffer headcount to cover uncertainty. This directly reduces idle labour hours and payroll waste during low-demand windows.
How many pincodes or locations are needed before hyperlocal forecasting becomes worthwhile?
Hyperlocal forecasting adds value from the moment a brand operates more than one dark store, because even two nearby locations can have distinct demand patterns. The ROI grows sharply as coverage expands to tens or hundreds of pincodes.