Introduction
For a regional FMCG brand selling on Blinkit or Zepto, a stockout directly suppresses your product's search ranking, reduces ad visibility, and can trigger delisting from active pincodes. Platforms expect brands to maintain above 90% fill rates; drop below 80% consistently, and your visibility collapses.
Demand forecasting prevents this. It predicts future customer demand using historical sales data, platform signals, and market trends, so brands stock the right quantity in the right dark store before a gap appears. This article breaks down how forecasting works, why it matters for FMCG and Quick Commerce brands, and how to build a stronger process.
TLDR:
- Demand forecasting predicts future customer demand to optimise inventory across dark stores
- Stockouts on QC platforms trigger algorithmic penalties that suppress search rankings and can cause delisting
- Accurate forecasting reduces waste, protects margins, and keeps availability metrics in the safe zone
- AI-driven forecasting achieves 90-95% accuracy versus 55-65% from spreadsheet methods
- Festive and pincode-level demand swings require hyper-local forecasting to avoid gaps
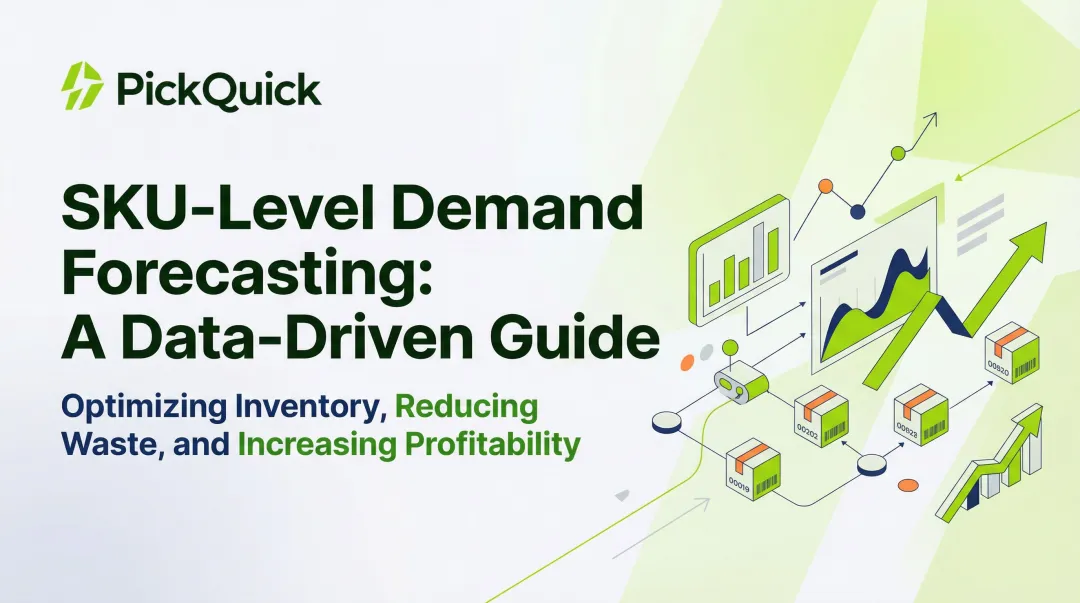
What Is Demand Forecasting?
Demand forecasting is the process of predicting future customer demand over a specific period using historical sales data, market trends, seasonal patterns, and other variables. Approaches range from simple spreadsheet-based trend analysis to AI-driven models analyzing over 200 demand signals simultaneously. No forecast is perfect, but directional accuracy delivers significant operational value—especially in Quick Commerce, where inventory decisions are made at the dark store and pincode level.
Two Broad Forecasting Categories
Two methodologies underpin most forecasting frameworks, and most effective strategies use both:
| Approach | When It Works Best | How It Applies in FMCG |
|---|---|---|
| Qualitative | New products, new markets, sparse data | Category managers estimate demand for a masala brand entering a new city using cultural preferences and competitive context |
| Quantitative | 60-90 days of clean SKU-level history available | Statistical models built on platform-level sales, city, and time period data |
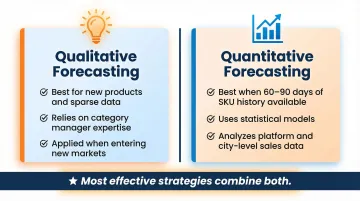
AI-powered quantitative forecasting analyzing over 200 demand signals can achieve 90-95% accuracy compared to 55-65% from traditional spreadsheet methods.
In practice, quantitative models provide the baseline. Qualitative inputs then adjust for market events, competitive moves, or festive surges that historical data alone cannot capture.
A Relatable India FMCG Example
Consider a masala brand navigating India's festive calendar. Demand doesn't move in a straight line — it spikes, plateaus, and drops in predictable phases:
- Pre-festive surge (Oct–Nov): Households stock up for Diwali cooking and wedding-season gifting, driving 2-3x normal SKU velocity
- Peak window: Dark store availability directly impacts platform search ranking and conversion
- Post-festive drop: Demand falls sharply as consumers work through existing inventory, raising overstock risk
Getting the forecast right is the difference between clean replenishment and two costly extremes: stockouts that lose sales and platform visibility, or aging overstock that ties up working capital and accumulates storage fees.
Why Demand Forecasting Is Critical for FMCG and Quick Commerce Brands
The Unique Pressure QC Creates
Unlike traditional retail where excess stock can sit in large warehouses, dark stores operate on finite shelf slots per SKU. Each dark store typically ranges from 2,000 to 4,000 square feet and is optimized for 10-minute fulfillment. Accurate forecasting determines what gets stocked, in what quantities, and when—making it directly tied to a brand's platform visibility and availability metrics.
Forecasting is a direct growth lever. Brands that get it right earn expanded inventory allocations (higher Max limits) and scale across more pincodes. Brands that get it wrong face shrinking shelf space and reduced platform presence.
Stockout = Platform Penalty
On Quick Commerce platforms like Blinkit and Zepto, consistent stockouts suppress a product in search results and can lead to removal from active listings. Blinkit expects brands to sustain above 90% fill rates; dropping below 80% consistently triggers algorithmic demotion, reducing search ranking and ad visibility.
The revenue impact compounds fast:
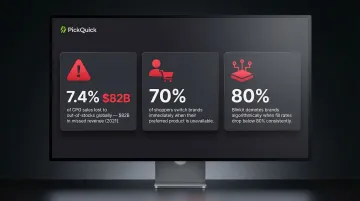
- CPG retailers globally lost 7.4% of sales to out-of-stocks in 2021—$82 billion in missed revenue
- 70% of shoppers switch brands immediately when their regular choice is unavailable
- On QC platforms, consumer patience is effectively zero — there's always a competing brand one scroll away
Multi-City Inventory and Cash Flow
For regional brands scaling across multiple cities and pincodes simultaneously, overstocking in one location ties up capital that cannot be deployed to higher-demand markets. A masala brand overstocked in Delhi cannot reallocate that inventory to Bengaluru where demand is stronger — each dark store operates independently with its own replenishment cycles.
Accurate forecasting enables leaner, more targeted allocation across geographies, freeing working capital for expansion rather than locking it in slow-moving stock.
Production and Procurement Alignment
FMCG brands — especially those in perishable categories like dairy or fresh bakery — must align manufacturing schedules with real platform demand. Without accurate forecasting, brands either under-produce and go out of stock or over-produce and absorb spoilage losses.
Both outcomes are costly. Dairy brands like Nandini or Aavin cannot produce excess inventory that expires before reaching consumers. A slow-moving SKU sitting for 90 days can consume 15-25% of gross margins through platform storage charges alone.
Pincode-Level Demand Variation
A South Indian dairy brand may see peak demand in Bengaluru and Chennai but slow uptake in Mumbai due to regional taste preferences, local competition, or cultural consumption patterns. Forecasting must account for regional and hyper-local demand profiles, not just aggregate national trends, to avoid misallocating inventory across dark store networks.
Quick Commerce runs on pincode-level precision. Brands that forecast at the national level will consistently overstock the wrong markets and understock the right ones — eroding both margins and platform rank.
Key Benefits of Demand Forecasting
Fewer Stockouts, Stronger Platform Performance
Maintaining high availability metrics is one of the most important ranking factors on QC platforms. Blinkit's algorithm prioritizes availability over sales volume—the platform prefers a brand with 400 orders per day and 98% availability over a brand with 1,200 orders per day and 60% availability.
CPG retailers lost 7.4% of sales to out-of-stocks in 2021, and the Quick Commerce penalty is more severe because algorithmic demotion compounds the loss—today's stockout reduces tomorrow's search visibility. Forecasting protects against this by ensuring inventory is present when demand occurs.
Reduced Inventory Waste
For perishable and fast-moving categories, accurate forecasting reduces spoilage and dead stock by tying procurement to actual consumption patterns rather than guesswork.
A dairy brand that over-produces by 20% doesn't just waste production costs. The fees stack quickly:
- Inwarding fees: ₹5 per unit
- Storage fees: ₹1 per unit per day
- Return-to-Vendor charges: ₹50 per item if stock ages out
The direct impact on margin is significant. Forecasting prevents brands from producing or procuring more than the market will consume within shelf-life windows.
Optimized Replenishment Cycles
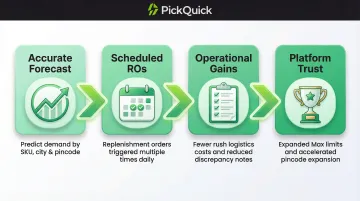
Forecasting enables brands to build predictable, scheduled replenishment triggers rather than reactive, emergency restocking. When brands forecast demand accurately, Replenishment Orders (ROs) run on regular cycles—multiple times daily—without the chaos of last-minute restocks. Clean RO discipline delivers measurable operational gains:
- Cuts rush logistics costs
- Reduces Discrepancy Notes (DNs) from hurried shipments
- Builds platform trust that unlocks expanded Max limits and faster pincode expansion
Smarter Pricing and Promotional Timing
Knowing when demand is naturally high allows brands to protect margins by not discounting during peak periods. A masala brand doesn't need to run promotions two weeks before Diwali—demand is already strong. Conversely, identifying slow periods in advance creates opportunities to run targeted promotions that drive sell-through without eroding overall profitability.
Promotional planning informed by demand forecasts maximizes ROI and prevents margin-destroying discounts during periods when consumers were already willing to pay full price.
Competitive Advantage Through Consistent Availability
Brands that maintain in-stock rates build stronger platform presence—higher search impressions, better conversion rates, and improved customer retention—compared to competitors who stock out frequently.
The effect compounds over time. Better availability improves algorithmic ranking, which increases visibility, which drives more sales, which justifies expanded Max limits. Brands that forecast well don't just perform better today—they become progressively harder to displace as that cycle repeats.
What Factors Influence Demand?
India's Festive and Seasonal Calendar
Diwali, Navratri, Eid, Onam, Pongal, and harvest seasons create predictable demand surges for FMCG categories. During Diwali 2025, quick commerce order volumes surged by 120% year-on-year, driven by higher order frequency rather than larger basket sizes.
Back-to-school periods, summer months (driving beverage demand), and monsoon season (shifting snack and comfort food consumption) add further category-specific demand shifts. Brands need to build stock 10-14 days before major festive peaks to ensure dark stores are fully loaded when demand arrives.
Geography and Regional Preferences
Demand for specific products varies significantly by city, state, and even neighborhood. A masala brand strong in Maharashtra may have entirely different demand velocity in Karnataka due to distinct regional cuisines, local competition, and cultural consumption habits.
Migration patterns also influence demand—cities with large student populations see demand spikes at semester start, while industrial hubs see shifts based on factory shift schedules. Pincode-level demand forecasting accounts for these hyper-local variations, ensuring inventory is allocated where it will actually sell rather than distributed uniformly across geographies.
Competition and Macro Conditions
Several external signals can shift demand sharply, and forecasts that ignore them will consistently miss:
- Competitor stockouts create temporary demand uplift as consumers substitute your brand
- New entrants with aggressive discounts can suppress demand until the promotional period ends
- Inflation shifts preference from premium to value SKUs within the same category
- Platform flash sales (Swiggy Instamart app-level discounts, for example) can exhaust dark store inventory within hours
Scenario planning for platform events—building separate "event inventory" buffers—is what separates brands that capture the spike from those that run out during the highest-visibility windows.
Common Challenges in Demand Forecasting
Insufficient or Fragmented Data
Many regional brands lack organized, SKU-level sales history broken down by platform, city, and time period. Brands selling on Blinkit, Zepto, and Swiggy Instamart simultaneously often struggle to consolidate demand signals from multiple platform dashboards into a single coherent view.
Even 60-90 days of clean, channel-specific data is a workable starting point. Brands don't need years of history—they need structured, consistent records of which SKUs sell where and when.
Over-Reliance on Intuition Without Data Validation
Seasonal experience and category knowledge are valuable, but QC platforms move faster than intuition alone can track. Demand can spike or collapse within days based on platform promotions, competitor stockouts, or a viral social media moment.
A masala brand owner with 20 years in the business understands festive demand patterns—but may not anticipate how a competitor's stockout on Blinkit creates a sudden 40% uplift in their own sales for two weeks.
Calibrating gut-feel forecasts against actual sales data prevents costly misjudgments.
Failure to Plan for Demand Spikes
Platform-driven sales events—like Swiggy Instamart's flash promotions or app-level discounts—can create sudden surges that exhaust dark store inventory within hours. During festive events, GMV can reach 1.6x Business-As-Usual levels, with consumers making multiple, small, occasion-led orders rather than consolidated baskets.
Brands that prepare for these windows typically:
- Pre-position extra stock in high-velocity dark stores before platform events
- Maintain availability when competitors go out of stock
- Capture incremental sales during the highest-visibility hours of the event
How to Improve Your Demand Forecasting Process
Start with Clean, Channel-Specific Sales Data
Pull sales history by SKU, platform, and city or pincode for at least the past 90 days. Identify the highest-velocity SKUs per location, note when stockouts occurred, and look for any clear seasonal or weekly patterns.
A structured log creates a solid foundation. Track:
- SKU-level sales by day and week
- Platform-specific performance (Blinkit vs. Zepto vs. Instamart)
- City and pincode-level velocity differences
- Stockout events and their duration
This baseline data enables quantitative forecasting and reveals patterns that intuition alone would miss.
Look Beyond Sales History for Demand Signals
Platform metrics like search impressions, add-to-cart rates, and out-of-stock event logs reveal unmet demand that pure sales data misses. If your product was out of stock for five days, those days show zero sales—but the true demand was higher.
Three signals help brands close the gap between potential demand and realized demand:
- Search impressions show how often your product surfaces — high impressions with low sales often signal a stock availability problem, not weak demand
- Add-to-cart rates capture buyer intent that never converts when stock runs out
- Out-of-stock logs mark the exact days demand existed but went unfulfilled
These signals enable more accurate upward adjustments in forecast quantities, preventing future stockouts.
Build a Festive and Event Calendar into Your Replenishment Triggers
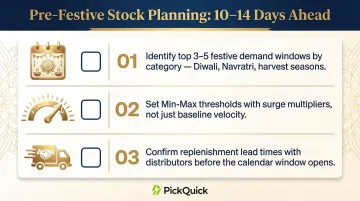
Map your category's demand spikes to India's festive, agricultural, and cultural calendar. Pre-emptive replenishment—building dark store stock 10-14 days before major peaks—consistently outperforms reactive restocking. Key actions for this phase:
- Identify your top 3-5 festive demand windows by category (Diwali, Navratri, harvest seasons)
- Set Min-Max thresholds that account for surge multipliers, not just baseline velocity
- Confirm replenishment lead times with distributors before the calendar window opens
PickQuick manages this operational layer for regional brands across Blinkit, Zepto, Swiggy Instamart, and JioMart—tracking pincode-level demand visibility and coordinating pre-festive stock builds by location so availability metrics stay stable even during demand surges.
Frequently Asked Questions
What is the difference between demand forecasting and demand planning?
Demand forecasting is the process of predicting future customer demand based on historical data and market signals. Demand planning is the broader operational process of using those forecasts to make decisions about inventory, production, and replenishment. In short, forecasting tells you what demand will be; planning determines how you respond to it.
How does demand forecasting affect inventory management?
Accurate forecasts set optimal stock levels for each dark store, reducing stockouts (which lose sales and hurt platform rankings) and overstock (which ties up capital and, for perishables, leads to waste). Availability metrics that platforms use to rank products depend directly on getting these levels right.
What data do I need to start demand forecasting?
Start with SKU-level sales data by channel, city, and time period — even 60-90 days of structured data is enough to identify usable patterns. More advanced forecasting adds platform metrics (search impressions, add-to-cart rates, out-of-stock logs), seasonal calendars, and promotional event data to capture unmet demand and sharpen accuracy.
How often should demand forecasts be updated?
Fast-moving SKUs need at least a weekly review, plus a deeper monthly pass that accounts for upcoming festivals, planned promotions, and shifts in sell-through rates. High-velocity or perishable categories — especially during festive periods — may need daily adjustments.
Why is demand forecasting especially important on Quick Commerce platforms?
QC platforms operate on limited dark store inventory, and platform algorithms reward consistent availability. Stockouts not only lose immediate sales but can suppress search visibility, reduce ad effectiveness, and trigger delisting from active pincodes. Platforms expect brands to maintain above 90% fill rates—accurate forecasting is the only way to meet this threshold consistently across all locations.