Introduction
A customer opens Blinkit or Zepto on Sunday morning to order their usual curd brand. The listing shows "out of stock." Within 10 seconds, they tap a competitor brand and complete checkout. That single stockout cost more than one sale. It severed a purchase habit and handed a repeat customer to a rival.
For regional FMCG brands scaling across quick commerce platforms, stockouts don't just reduce revenue. They trigger algorithmic penalties that suppress visibility for weeks, accelerate customer attrition in high-frequency categories, and erode brand equity built over decades in offline markets.
This guide covers what stockouts are, why they hit harder on QC platforms than traditional retail, how to calculate their true cost, and proven strategies to prevent them — written specifically for fast-moving consumer brands managing inventory across multiple cities and platforms.
Key Takeaways
- Stockouts occur when customer demand exists but inventory is zero — purchase cannot happen
- Costs span lost sales, brand switching, platform ranking penalties, and eroded customer lifetime value
- Calculate stockout rate: (Stockout Incidents ÷ Total Demand Opportunities) × 100
- Prevention relies on demand forecasting, safety stock buffers, and automated reorder triggers
- On QC platforms, stockouts trigger listing suppression — the revenue impact extends weeks beyond the stockout window
What Is a Stockout? Meaning and Real-World Examples
A stockout (also written as "stock-out" or "out-of-stock") occurs when a product's available inventory reaches zero at the point of sale, making it impossible to fulfil customer demand at that moment. Unlike a backorder — where a customer can still place the order and wait for future fulfilment — a stockout typically means the purchase cannot happen at all.
In quick commerce, there is no waiting. When a customer sees "out of stock" on Blinkit, they scroll past within seconds and that sale is gone.
Stockout vs. Out-of-Stock: Is There a Difference?
In common usage, "stockout" and "out-of-stock" (OOS) are interchangeable. However, there's a subtle distinction: "out-of-stock" typically describes the visible state on a shelf or platform listing, while "stockout" refers to the underlying inventory management event. Both end the same way: lost revenue and customers who quietly move to a competitor brand.
Real-World Examples of a Stockout
Example 1: Festival season surge
A masala brand's top-selling SKU goes out of stock on Blinkit during Diwali because replenishment orders weren't confirmed in time. The listing disappears from search results. Customers seeking the product during the highest-demand window switch to competitor brands, many never returning.
Example 2: Sunday morning dairy gap
Six hours. That's how long a regional dairy brand's curd packets sat at zero inventory in a Zepto dark store one Sunday morning. By the time stock was restored, customers had already placed orders with competing brands — and several didn't come back.
Example 3: Campaign backfire
An FMCG brand launches a promotional campaign driving 3x normal demand. Inventory wasn't pre-positioned across dark stores. The campaign generates thousands of clicks but minimal conversions — customers arrive to find empty listings and leave frustrated.
What Causes Stockouts?
Stockouts rarely happen for a single reason. They result from a chain of failures across forecasting, replenishment, and operational execution. Research shows that 72% of stockouts stem from manageable planning issues rather than external supply chain disruptions.
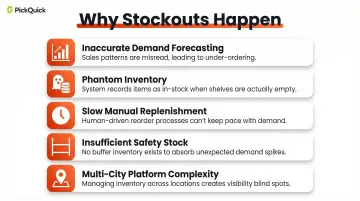
Inaccurate Demand Forecasting
47% of retail out-of-stocks occur due to forecasting errors. Brands relying on gut feel or outdated sales averages miss demand spikes during festivals, weekends, or promotional periods — the exact moments when quick commerce order volumes peak.
Phantom Inventory (System vs. Reality Mismatch)
In the grocery sector, only 35% of inventory records are exactly accurate. The system shows stock available, but the dark store shelf is empty. This phantom inventory problem prevents automated reorder triggers from activating — so the stockout compounds silently.
Slow or Manual Replenishment Cycles
Brands without automated reorder triggers respond to stockouts reactively, after the sale is already lost. On quick commerce platforms where replenishment cycles run multiple times daily, manual processes create costly delays that no buffer stock can absorb.
Three additional causes compound the above:
- Insufficient safety stock — No buffer inventory for demand variability or supplier delays leaves brands exposed the moment deliveries slip.
- Supply chain disruptions — Late deliveries, vendor stockouts, or logistics failures create inventory gaps precisely when availability matters most.
- Multi-city, multi-platform complexity — For regional brands scaling across Blinkit, Zepto, Swiggy Instamart, and JioMart simultaneously, each city, platform, and dark store becomes a separate stockout risk. Without pincode-level visibility and platform-specific replenishment discipline, each new market adds another potential failure point.
Understanding these causes matters because the costs they trigger — lost revenue, suppressed rankings, and eroded customer trust — are far larger than most brands anticipate.
The Real Cost of a Stockout
The most dangerous aspect of stockout costs is their invisibility in standard reports. A brand sees declining orders and assumes demand has softened — when actually stockouts are erasing revenue silently.
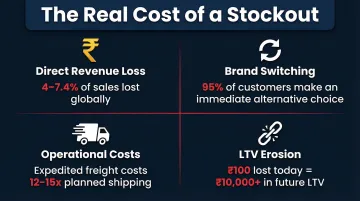
Direct Revenue Loss
Every day a product is out of stock, revenue is lost. The spill rate — the percentage of potential sales lost during a stockout period — quantifies this. Globally, stockouts lead to an average 4% in lost sales, while CPG retailers specifically lost 7.4% of sales due to stockouts in 2021.
Consumer behaviour research reveals that only 5% of customers are willing to wait for a product to return to stock. The remaining 95% make an immediate alternative choice.
Brand Switching and Customer Attrition
Stockouts in fast-moving categories — dairy, masala, snacks, beverages — accelerate brand switching because purchases are habitual and immediate. When a customer can't find Brand A, they select Brand B.
Quick commerce data shows that 50% of consumers switch to another QC platform to find the same product, while 70% search traditional e-commerce platforms like Amazon or Flipkart when an item is unavailable. The stockout doesn't just lose one transaction — it breaks the purchase habit entirely.
Increased Operational Costs
Stockouts create three operational cost drivers:
- Customer service overhead — More complaints, negative reviews, and support queries that consume team bandwidth
- Expedited freight — Emergency replenishment orders requiring air shipping cost 12-15 times more than planned ocean shipping
- Split shipments — When items aren't available from the same location, orders get split across facilities, increasing per-unit logistics costs
Platform Ranking and Visibility Penalties
This is the QC-specific cost most brands don't account for. On platforms like Blinkit, Zepto, and Swiggy Instamart, availability is a ranking signal. When a SKU goes out of stock repeatedly, the platform's algorithm deprioritises it in search results and category pages.
On Blinkit specifically, the penalties are concrete:
- Fill rates below 80% trigger algorithmic demotion, reducing search rank and ad visibility
- The platform expects sustained fill rates above 90% for optimal performance
- Blinkit's inventory-led ad system suppresses ad spend in pincodes where products are out of stock, regardless of budget allocation
- Recovering lost ranking after restocking can take 2-3 weeks, compounding revenue loss well beyond the stockout window
Long-Term Brand Equity Erosion
Repeated stockout experiences damage brand trust, especially for regional brands where the brand-consumer relationship is built on local consistency and reliability. Customers who associate a brand with unavailability stop buying and start recommending competitors instead.
This is lifetime value erosion in practice. Each stockout doesn't just lose ₹100 in immediate revenue — it potentially eliminates ₹10,000+ in future customer lifetime value.
How to Calculate Your Stockout Rate
Most brands track fill rate — the percentage of orders successfully fulfilled — but that number only tells half the story. Stockout rate captures something fill rate misses entirely: demand that never converted because the product simply wasn't available.
The Stockout Rate Formula
Stockout Rate (%) = (Number of Stockout Incidents ÷ Total Demand Opportunities) × 100
Variables defined:
- Stockout incidents — Occasions when a customer attempted to buy but couldn't due to zero inventory
- Total demand opportunities — Both successful sales and missed purchase attempts
Example calculation:
If a SKU had 50 demand opportunities in a month and was out of stock on 8 occasions, the stockout rate is 16%.
Calculating Stockout Cost (The Spill Rate Method)
The spill rate methodology quantifies revenue lost during stockouts by comparing sales velocity on in-stock days versus out-of-stock days.
Steps:
- Track daily inventory position — was the item in stock at the start of each day?
- Calculate average daily sales on in-stock days vs. out-of-stock days. The gap between the two figures is your spill rate — and often larger than expected.
- Multiply: Annual Sales × Stockout Rate × Spill Rate = Estimated Annual Lost Sales
Example calculation:
₹1 crore annual sales × 8% stockout rate × 50% spill rate = ₹4 lakh in lost revenue
This formula surfaces the hidden cost that standard reporting never shows — and once you can quantify it, the next question becomes: which SKUs should you protect first?
The 80/20 Rule for Inventory (ABC Analysis)
Research on 22 CPG categories found that roughly 73% of sales come from the top 20% of SKUs at the brand level. This is the Pareto principle at work in your catalogue.
These A-class items should receive:
- Highest safety stock levels
- Tightest replenishment monitoring
- Priority in working capital allocation
A stockout on an A-class SKU costs disproportionately more than a stockout on a slow-moving variant. For a brand doing ₹1 crore/month, losing availability on one top SKU for three days can wipe out more revenue than a week of stockouts across ten tail SKUs combined.
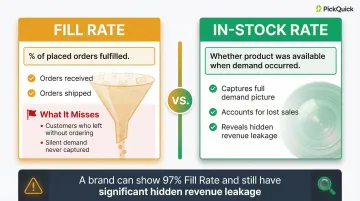
In-Stock Rate vs. Fill Rate: Why the Distinction Matters
These two metrics sound similar but measure fundamentally different things:
| Metric | What It Measures | What It Misses |
|---|---|---|
| Fill Rate | % of placed orders fulfilled | Customers who left without ordering |
| In-Stock Rate | Whether product was available when demand occurred | Nothing — it captures the full picture |
Fill rate is a falsely optimistic measure because it only counts orders that were actually placed. When a customer sees an "out of stock" badge on Blinkit and exits, no order is recorded — so fill rate stays high while revenue quietly bleeds.
A brand can report a 97% fill rate and still have significant hidden leakage. The metric shift that matters: track in-stock rate, not just fill rate.
6 Proven Ways to Prevent Stockouts
Prevention requires combining better data, smarter processes, and disciplined operational execution. These six strategies apply across e-commerce and quick commerce contexts.
1. Implement Demand Forecasting Based on Historical Sales Velocity
Accurate forecasting requires analysing past sales patterns by SKU, factoring in:
- Seasonality (festivals, weather patterns)
- Promotional periods and campaign cycles
- Regional demand variation and local preferences
Static spreadsheet-based forecasting is inadequate for fast-moving brands on multiple platforms. Forecasting tools should account for demand spikes — festivals, weekends, campaigns — not just average daily sales. The goal is to predict when normal demand will triple, then plan stock positions around that peak — not around average movement.
2. Set Smart Reorder Points and Safety Stock Levels
Reorder point = (Average Daily Sales × Lead Time) + Safety Stock
The reorder point is the inventory level at which a new replenishment order must be triggered. Safety stock is the buffer held to absorb demand variability and supplier delays.
These should not be static numbers. Update reorder points and safety stock levels as sales velocity changes. A SKU selling 20 units/day in February may sell 60 units/day during Diwali — the reorder point must adjust accordingly.
3. Maintain Real-Time Inventory Visibility Across All Channels and Locations
Phantom inventory — system says in-stock, shelf is empty — is one of the leading causes of silent stockouts. Research shows that 65% of inventory records contain inaccuracies.
Real-time inventory tracking prevents automated systems from assuming stock exists when it doesn't. For dark store operations managing thousands of pincodes, this means daily position snapshots, not monthly counts.
Studies confirm that correcting inventory record inaccuracies through stock audits delivers 4-11% sales uplifts by preventing phantom stockouts.
4. Use the 80/20 Rule to Prioritise Stock Management
Apply ABC analysis practically: your top 20% of SKUs by revenue should have:
- Higher safety stock thresholds
- More frequent replenishment cycles
- Priority in working capital allocation
Don't spread inventory management effort equally — concentrate it where stockouts hurt the most. A stockout on your hero SKU during peak demand destroys more value than ten stockouts on slow-moving variants.
5. Diversify Suppliers and Build Replenishment Redundancy
Single-supplier dependency creates risk: one delayed shipment triggers a multi-day stockout. Maintain at least one backup supplier or alternative source for top-performing SKUs.
For regional FMCG brands with concentrated supplier relationships, even a 24-hour delay from a single source can cascade into platform-level availability penalties — making backup sourcing a non-negotiable for high-velocity SKUs.
6. Automate Replenishment Triggers and Min-Max Optimisation
Min-Max inventory management sets a minimum stock level (the reorder point) and a maximum stock level (the replenishment ceiling). When inventory hits the minimum, an automated order triggers to bring stock back to the maximum.
This removes human lag from replenishment decisions. For quick commerce, where platforms expect multiple replenishment cycles daily, automation is essential.
For brands managing inventory across 10,000+ pincodes on Blinkit, Zepto, and Swiggy Instamart, manual replenishment decisions simply don't scale. PickQuick's Min-Max optimisation automates dark store replenishment across all three platforms, keeping availability metrics stable without requiring brand teams to monitor stock positions manually.
Why Stockouts Hit Harder on Quick Commerce Platforms
In traditional retail, a customer who finds a product out of stock might return tomorrow or visit another store. On a QC platform, the customer's decision window is under 30 seconds. They scroll past, switch brands, and the moment is gone. There is no loyalty buffer in a 10-minute delivery mindset.
The entire journey from product discovery to purchase happens in a single session, typically under 10 minutes. No drop-off points exist between impression and checkout.
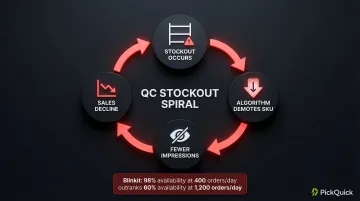
The Platform Penalty Loop
Stockouts on QC platforms don't just lose the immediate sale. Algorithms track availability metrics and deprioritise low-availability SKUs in search rankings. Lower rankings mean fewer impressions. Fewer impressions reduce sales. Lower sales further diminish platform standing.
This is the stockout spiral that regional brands fall into when replenishment discipline breaks down.
Blinkit's algorithm explicitly prioritises availability over sales volume. A brand with 400 orders/day and 98% availability outranks a brand with 1,200 orders/day and 60% availability. Availability isn't a contributing factor to the algorithm — it is the algorithm.
The Regional Brand Challenge
That penalty hits regional brands particularly hard. Strong offline GT/MT presence doesn't translate into QC operational capability — and managing dark store replenishment across multiple cities and platforms simultaneously is a different operational problem entirely.
India's QC market has doubled annually, reaching an estimated ₹10-11 billion in 2025. That growth rewards brands with clean availability metrics and sidelines those that can't maintain consistent supply across dark stores.
For brands without dedicated QC infrastructure, working with an operator like PickQuick — which brings existing dark store relationships, pincode-level demand data, and automated replenishment systems — provides a faster path to stable availability than building those capabilities in-house. The practical advantages include:
- Pre-mapped dark store networks across multiple cities and platforms
- Pincode-level demand visibility to anticipate replenishment needs
- Automated reorder triggers that reduce manual monitoring
- Platform compliance management across Blinkit, Zepto, Instamart, and JioMart
Frequently Asked Questions
What is the best way to track inventory?
The best approach combines real-time inventory management software with daily position snapshots for each SKU. For brands on quick commerce platforms, this means tracking availability at the dark store level — not just at the warehouse — to catch phantom inventory before it causes a stockout.
How do you calculate stockouts?
Use the formula: Stockout Rate (%) = (Stockout Incidents ÷ Total Demand Opportunities) × 100. Also use the spill rate method for revenue impact: Annual Sales × Stockout Rate × Spill Rate.
Which are examples of a stockout?
Common examples include:
- A dairy brand running out of curd on a Sunday morning on Zepto
- A masala brand's hero SKU going out of stock on Blinkit during Diwali
- An FMCG product disappearing from a dark store shelf while the system still shows it as "available"
What is the 80/20 rule for inventory?
The Pareto rule in inventory means roughly 80% of your revenue comes from 20% of your SKUs. These high-revenue A-class items should receive higher safety stock, more frequent replenishment cycles, and priority attention to prevent stockouts.
What is the difference between a stockout and out-of-stock?
Both terms are used interchangeably in practice. "Out-of-stock" describes the visible state on a shelf or platform, while "stockout" refers to the inventory event. Both result in lost sales and potential customer attrition.
How do stockouts affect rankings on Blinkit or Zepto?
QC platforms use availability as a ranking signal, so products that frequently go out of stock get deprioritised in search and category pages. Recovering lost rankings after restocking can take several weeks, multiplying the revenue impact well beyond the stockout window.