Introduction
Regional FMCG brands scaling on quick commerce face a core operational tension: demand on platforms like Blinkit and Zepto changes by the hour, yet most brands still rely on weekly or monthly replenishment cycles built for general trade. This structural mismatch drives two costly failures—stockouts that trigger algorithmic de-listing in high-velocity pincodes, and dead stock accumulation where demand signals were misread.
Global retail inventory distortion cost $1.77 trillion in 2023, driven largely by FMCG forecast errors of 30–45%. For a typical ₹500 crore brand, that translates to ₹50–90 crore in annual losses.
In quick commerce, these failures compound further. Stockouts don't just mean lost sales—they suppress algorithmic ranking and ad visibility until availability is fully restored.
What this guide covers:
- What AI demand forecasting is and how it differs from traditional forecasting methods
- Why conventional forecasting fails in quick commerce warehouse environments
- The mechanics behind AI models: data inputs, probabilistic forecasting, real-time demand sensing
- Implementation pathways, use cases, and measurable benefits for FMCG brands operating in high-velocity dark store networks
Key Takeaways
- AI forecasting uses machine learning to predict SKU-level demand continuously, replacing static monthly planning with real-time pincode-level intelligence
- Traditional forecasting fails in quick commerce because it cannot respond to hourly demand shifts, hyper-local pincode variations, or platform-specific ranking penalties
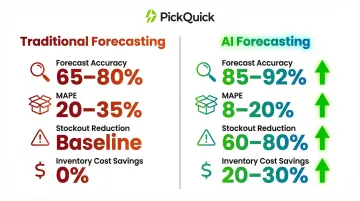
- Machine learning models reduce forecast errors by 50%+, cutting stockouts by 60-80% and inventory costs by 20-30%
- Implementation requires clean data, WMS integration, and platform API connections; brands can build in-house or use operators with embedded forecasting systems
- PickQuick manages pincode-level demand visibility and Min-Max replenishment across 10,000+ pincodes for 25+ regional brands, delivering clean replenishment and stable availability metrics
What Is AI Demand Forecasting for Warehouses?
AI-powered demand forecasting uses machine learning models to analyze historical order data, real-time inventory signals, and external demand inputs to generate SKU-level predictions. Unlike traditional planning cycles that produce static forecasts reviewed weekly or monthly, AI forecasting operates as a continuously updating engine that adapts as conditions change.
How it differs from traditional statistical forecasting:
Traditional methods project future demand from historical averages: moving averages, exponential smoothing, seasonal decomposition. These models assume demand patterns are stable and linear.
AI forecasting identifies multi-variable patterns across a much wider signal set, updating predictions in near real time rather than waiting for the next planning review. Inputs typically include:
- Order velocity trends by platform and pincode
- Regional consumption behavior and category seasonality
- External signals such as weather, promotions, and local events
- Platform-level availability and out-of-stock history
For warehouse operators managing quick commerce dark stores, this means shifting from "we'll reorder next Tuesday based on last month's sales" to "the system detected a velocity spike in Gurgaon pincodes 122001-122003 and triggered replenishment 6 hours before stockout risk materialized."
The output format differs just as sharply. Traditional forecasting delivers a single demand number per SKU per period. AI forecasting outputs probability distributions: a range of likely demand outcomes with confidence intervals. That range gives planners the data to set smarter safety stock levels without the cost of over-buffering every SKU.
Why Traditional Demand Forecasting Fails Quick Commerce and Dark Store Operations
Weekly Planning Cycles vs. 4-Hour Replenishment Windows
Traditional FMCG forecasting was designed for weekly replenishment cycles and general trade distribution, not for dark stores where a single pincode might cycle through stock within 24–48 hours. Dark store replenishment cycles have compressed from 12 hours to 4 hours as platforms integrate vendor tech and run multiple RO (Replenishment Order) cycles daily.
This velocity mismatch creates operational chaos. Brands planning inventory on weekly schedules cannot respond when demand spikes 300% during a local heatwave or when a competing dark store runs out of stock and redirects traffic to your pincode. By the time the next planning cycle detects the shift, the stockout has already triggered platform penalties.
Stockouts Trigger Algorithmic Demotion — Not Just Lost Sales
Stockouts in quick commerce don't just mean lost sales—they trigger algorithmic de-listing. Blinkit requires brands to maintain a 90%+ fill rate; dropping below 80% triggers algorithmic demotion, reducing search ranking, ad visibility, and active pincode coverage. Blinkit's ad system is inventory-led, meaning ads only surface in pincodes where the product is physically present—stockouts suppress ad spend entirely in affected areas.
Zepto's algorithm de-ranks out-of-stock SKUs aggressively, where a two-day stockout can set back search placement by weeks. Approximately 70% of consumers switch to a competing brand when their preferred product is unavailable, and nearly half abandon the platform entirely.
SKU-Level Demand Is Harder to Predict in Quick Commerce
Order patterns are hyper-local, shaped by neighborhood demographics, competing dark stores, platform promotions, and time-of-day velocity spikes. City-level averages mask up to 21% of recurring stockouts at the hyperlocal level. A masala brand might see strong velocity in South Delhi pincodes where regional cuisine dominates, while identical SKUs stagnate in North Delhi neighborhoods with different consumption patterns.
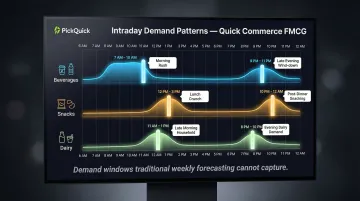
Demand also shifts sharply within the day. Beverages spike between 7-10 AM and again in late evenings; snacks peak during 12-3 PM and post-dinner hours. Traditional forecasting cannot capture these hourly swings, leading to stockouts during peak windows and overstocking when velocity drops.
Multi-Platform Complexity
Brands operating across Blinkit, Zepto, Swiggy Instamart, and JioMart face layered complexity. Each platform runs on different logic:
- Blinkit and Zepto operate on multi-daily replenishment with aggressive ranking penalties for stockouts
- Swiggy Instamart ties availability to hyperlocal dark store coverage and promotional scheduling
- JioMart favors bulk pack sizes aligned to monthly purchasing cycles
Forecasting at the platform-SKU-pincode intersection requires a granularity that weekly planning cycles simply weren't built for.
How AI Demand Forecasting Works: The Mechanics Behind the Models
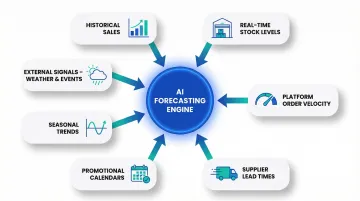
AI warehouse forecasting ingests multiple data inputs to generate actionable predictions:
- Historical sales volumes per SKU per pincode
- Real-time stock levels across dark stores and motherhubs
- Platform-reported order velocity and availability scores
- Supplier lead times and replenishment cycle speeds
- Promotional calendars and sale event schedules
- Seasonal trends and consumption patterns
- External signals such as weather, local events, and competing dark store stockouts
From Raw Data to Actionable Forecast
Data is ingested and standardized from multiple sources—WMS systems, ERP platforms, and platform APIs (Blinkit Seller Hub, Zepto Partner Portal, Instamart dashboards). Machine learning models detect demand patterns and anomalies, translating raw signals into SKU-level forecasts with confidence intervals rather than single-point predictions.
Models such as XGBoost and LightGBM demonstrate clear superiority over deep learning approaches across most retail scenarios, with XGBoost achieving the lowest forecast error in localized individual-group settings. These gradient boosting methods excel at identifying complex, non-linear patterns across sequential data—critical for quick commerce where demand is influenced by dozens of interacting variables.
AI forecasting systems go beyond producing a number. The output triggers operations: dynamic reorder point recommendations, safety stock recalculations, stockout risk alerts, and replenishment instructions that feed directly into warehouse management systems.
Probabilistic vs. Deterministic Forecasting
Deterministic forecasting states "you will sell 500 units next week" based on a median prediction. This approach forces planners to apply safety stock formulas that assume normal distribution—a flawed assumption in quick commerce where demand spikes are frequent and uneven.
Instead of over-buffering inventory to guard against worst-case scenarios, planners receive demand ranges with associated probabilities—enabling smarter allocation decisions across SKUs and pincodes.
Real-Time Demand Sensing vs. Periodic Forecasting
Periodic forecasting runs weekly or monthly on historical data, producing static predictions until the next review cycle. When demand shifts mid-week, that static forecast becomes a liability. Real-time demand sensing continuously ingests live signals—streaming transaction data, IoT sensor inputs from dark stores, mobile app behavior—to update predictions as conditions change.
Real-time architectures process streaming data using technologies like Apache Kafka and Flink for sub-second latency insights. Streaming ingestion updates online feature stores with 10-minute rolling windows for transaction counts, detecting rapid purchase sequences, while batch ingestion handles longer-term aggregations.
Periodic forecasting simply can't respond fast enough in quick commerce. A dark store seeing a 300% ice cream sales spike during a Gurgaon heatwave can't wait until next Tuesday's forecast review—the system must detect the velocity shift and trigger replenishment within hours.
Key Benefits of AI Demand Forecasting for Warehouse Operators
Improved Forecast Accuracy and Service Level
Machine learning models reduce forecast errors by 50%+, achieving 85-92% accuracy compared to traditional methods that typically deliver 65-80% accuracy. In retail, AI/ML methods reduce MAPE (Mean Absolute Percentage Error) from 20-35% to 8-20%.
This accuracy improvement translates directly to higher fill rates and fewer platform stockout events. AI-powered forecasting reduces product unavailability by up to 65%. AB InBev achieved a 60% reduction in out-of-stocks using o9 Solutions' AI-driven demand planning.
Inventory Cost Reduction
Accurate forecasting cuts costs on both ends: overstocking ties up working capital in slow-moving inventory, while stockouts trigger expensive emergency procurement. Brands using AI forecasting achieve 20-30% inventory cost savings and 60-80% stockout reductions.
These gains compound across a portfolio:
- Fewer emergency orders reduce per-unit procurement costs
- Lower safety stock levels free up warehouse space and cash
- Better sell-through rates improve margin on perishable or seasonal SKUs
Hindustan Unilever freed ₹200 Cr in working capital and achieved a 25% inventory reduction by implementing AI-powered forecasting for top SKUs. For brands scaling across multiple cities, this capital efficiency is critical—every crore locked in dead stock is a crore unavailable for expansion.
Platform Availability and Ranking Protection
Consistent stock availability directly drives growth in quick commerce. Brands that maintain high availability scores on Blinkit, Zepto, and Swiggy Instamart receive better algorithmic placement, which drives organic order volume without incremental ad spend.
Products with 95%+ fill rates rank higher in Swiggy Instamart's algorithm. On Blinkit, availability is the primary ranking signal—the platform prefers a brand with 400 orders/day and 98% availability over one with 1,200 orders/day and 60% availability.
Executing on this consistently requires pincode-level demand visibility, not just city-level averages. PickQuick's Min-Max optimization operates across 10,000+ pincodes and 25+ regional brands, maintaining replenishment discipline at the granularity these platforms actually measure—so brands hold their algorithmic rankings as they scale.
High-Impact Use Cases in FMCG and Quick Commerce Warehousing
Managing Demand Spikes for High-Frequency Categories
Dairy, masala, and snack categories don't spike uniformly — each has its own triggers, timing patterns, and velocity thresholds that standard inventory rules miss. Milk emerged as the most-ordered item across major Indian metros on Zepto in 2025, with 8.8 million units of Nandini milk sold in Bengaluru and 9 million units of Amul milk in Mumbai.
Most milk pouches sold through quick commerce are supplied after 11 AM or post 8 PM, aligning with times when physical shops run out. AI models trained on platform-level order data detect early velocity signals 24–48 hours before a spike materializes, triggering pre-emptive replenishment before dark store stock depletes.
A dark store operator in Delhi NCR used real-time monitoring to track 5,000+ SKUs hourly; when ice cream sales spiked 300% in Gurgaon during a heatwave, the system enabled restocking 6 hours before competitors. AI detected a weather-beverage correlation where a 5°C temperature increase led to an 18% Lipton sales spike in North India.
Seasonal and Promotional Inventory Planning
AI forecasting sizes inventory positions for peak periods by recognizing patterns across multiple years of sales data — not by inflating blanket safety stock. The models predict both the magnitude and timing of demand spikes, which cuts stockout risk during peaks and prevents dead stock when demand normalizes.
During Christmas 2025, quick commerce GMV reached ~1.3x of business-as-usual levels, driven by higher order volumes. On New Year's Eve 2025, order volumes scaled to ~1.4–1.5x of BAU, pushing GMV to ~1.6x of BAU.
Two examples show what this looks like in practice:
- ITC Foods used regional AI models with festival calendar integration to predict Diwali spike timing and magnitude — starting production 3 weeks earlier and achieving a 95% service level during peak versus 78% the prior year
- Fountain9's Kronoscope delivered a 20% reduction in out-of-stocks and excess inventory, and a 35% reduction in wastage costs for a food solutions company
Multi-City and Multi-Platform Inventory Positioning
Brands expanding across multiple Indian cities while operating on several QC platforms simultaneously need forecasts at the city-platform level, not just the national level. Equal distribution across dark store networks wastes inventory where demand is low and creates stockouts where it's high.
AI-generated city-platform forecasts address this directly. The result: lower inter-warehouse transfer costs and better availability where it actually matters. For instance, a brand might find that biryani masala sells strongly in Hyderabad pincodes 500001–500050 on Swiggy Instamart but stagnates on JioMart — while the reverse holds in Chennai. AI forecasting surfaces these platform-city-SKU patterns, guiding precise allocation decisions that traditional citywide averages miss entirely.
Key signals AI uses to build these forecasts include:
- Platform-level order velocity by pincode and time window
- Category-specific demand curves across cities with different consumption profiles
- Cross-platform availability gaps that signal where unmet demand exists
- Historical inter-city variation during festive and promotional windows
How to Get Started with AI Demand Forecasting for Your Warehouse
Data Readiness Is the Foundation
Successful implementation starts with clean, accessible historical sales data, real-time inventory visibility, and integration between WMS/ERP and platform data feeds. According to Forbes, poor data quality is the most common reason AI forecasting pilots fail — not limitations in the AI itself.
Minimum data requirements:
- 12-18 months of historical sales data per SKU per pincode
- Real-time inventory levels across warehouses and dark stores
- Platform order velocity data (via API integrations or manual exports)
- Supplier lead times and replenishment cycle documentation
- Promotional calendars and planned sale events
Brands with fragmented data—sales in one system, inventory in another, platform data in spreadsheets—must consolidate before AI forecasting can deliver value.
Phased Implementation Approach
Start with a pilot on a small set of high-velocity SKUs in a single city or dark store cluster. Establish baseline metrics (MAPE, stockout frequency, fill rate) and measure AI forecast performance against those baselines before scaling across the full portfolio. A contained pilot also gives your team concrete performance data to justify broader rollout internally.
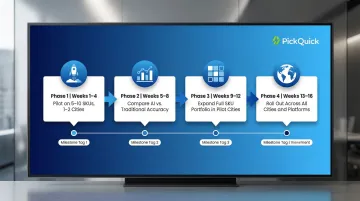
Typical implementation timeline:
- Weeks 1-4: Deploy on 5-10 high-velocity SKUs in 1-2 cities
- Weeks 5-8: Compare AI forecast accuracy against your traditional method baselines
- Weeks 9-12: Expand to the full SKU portfolio in pilot cities
- Weeks 13-16: Roll out across all cities and platforms
According to RELEX Solutions, most brands running a focused pilot see meaningful improvements in forecast accuracy and stockout frequency within the first 4–8 weeks, with inventory efficiency gains compounding as the model trains on more data over subsequent months.
Build vs. Partner Decision
Brands scaling on quick commerce platforms have two viable paths:
Build in-house AI forecasting capability:
- Requires a data warehouse, ETL pipelines, and API integrations
- Needs dedicated ML expertise (data scientists, ML engineers)
- WMS integration and platform API connectivity add further complexity
- 90-120 day development timeline minimum
- Ongoing maintenance and model tuning throughout
Partner with a specialized QC operator:
- PickQuick has pincode-level demand intelligence and replenishment systems already embedded in operations
- Manages 10,000+ pincodes across 25+ regional brands
- Provides real-time stock tracking, automated PO processing, and platform-level API integrations
- Delivers 3-5x faster go-live compared to independent onboarding
- No internal ML capability or data infrastructure required
For brands generating ₹25-30 lakh/month+ on Blinkit with strong offline demand (₹5-7 crore/month or more), the speed-to-value tradeoff strongly favors the partner path — especially when the alternative means a 90-120 day build before any forecasting value is realized.
Frequently Asked Questions
What is AI demand forecasting for warehouses?
AI demand forecasting uses machine learning models to predict future SKU-level demand by analyzing historical sales data, real-time inventory signals, and external factors such as weather, promotions, and platform velocity patterns. It replaces static planning cycles with a continuously updating system that improves warehouse replenishment decisions.
How is AI demand forecasting different for quick commerce dark stores compared to traditional warehouses?
Dark stores operate on replenishment cycles of 4-12 hours and hyper-local demand patterns at the pincode level, requiring forecasts that update in near real time to catch intra-day velocity spikes and avoid platform ranking penalties. Weekly or monthly models used in traditional warehouses simply cannot operate at that speed or granularity.
What data is needed for AI demand forecasting to work accurately in a warehouse?
Core inputs include:
- Historical order volumes per SKU
- Real-time inventory levels across dark stores and motherhubs
- Supplier lead times
- Platform order velocity data (from APIs or dashboards)
- Promotional calendars
- External signals: seasonality, weather, and local demand events
A minimum of 12-18 months of historical data is recommended for initial model training.
How does AI forecasting help prevent stockouts on platforms like Blinkit and Zepto?
AI models detect early demand velocity signals before stock depletes, trigger replenishment recommendations ahead of the stockout event, and maintain the availability scores that determine a brand's algorithmic ranking and visibility. Consistent high availability unlocks better search placement, ad visibility, and organic order volume without incremental ad spend.
What are the biggest challenges brands face when implementing AI demand forecasting?
The three most common barriers are poor or fragmented data quality, lack of integration between sales platforms and warehouse systems, and the time required to build internal ML capability. Brands that partner with an operator like PickQuick — which already has pincode-level demand visibility and a Min-Max replenishment system in place — can skip most of this buildout and go live faster.
How long does it take to see results from AI demand forecasting in a warehouse?
Most brands running a focused pilot on high-velocity SKUs can measure meaningful improvements in forecast accuracy and stockout frequency within the first 4–8 weeks. Broader inventory efficiency gains—working capital reduction, dead stock elimination, platform availability improvements—compound as the model trains on more data over subsequent months.